Two distinct subpopulations of nestin-positive cells in adult mouse dentate gyrus - PubMed (original) (raw)
Two distinct subpopulations of nestin-positive cells in adult mouse dentate gyrus
Satoshi Fukuda et al. J Neurosci. 2003.
Erratum in
- J Neurosci. 2004 Jan 7;24(1):24
Abstract
Neurogenesis in the dentate gyrus of the adult mammalian hippocampus has been proven in a series of studies, but the differentiation process toward newborn neurons is still unclear. In addition to the immunohistochemical study, electrophysiological membrane recordings of precursor cells could provide an alternative view to address this differentiation process. In this study, we performed green fluorescent protein (GFP)-guided selective recordings of nestin-positive progenitor cells in adult dentate gyrus by means of nestin-promoter GFP transgenic mice, because nestin is a typical marker for precursor cells in the adult dentate gyrus. The patch-clamp recordings clearly demonstrated the presence of two distinct subpopulations (type I and type II) of nestin-positive cells. Type I cells had a lower input resistance value of 77.1 M(Omega) (geometric mean), and their radial processes were stained with anti-glial fibrillary acidic protein antibody. On the other hand, type II nestin-positive cells had a higher input resistance value of 2110 MOmega and expressed voltage-dependent sodium current. In most cases, type II cells were stained with anti-polysialylated neural cell adhesion molecule. Taken together with a bromodeoxyuridine pulse-chase analysis, our results may reflect a rapid and dynamic cell conversion of nestin-positive progenitor, from type I to type II, at an early stage of adult neurogenesis in the dentate gyrus.
Figures
Figure 1.
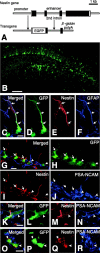
GFP-expressing cells in the dentate gyrus of adult nestin promoter-GFP mice. A, Structure of nestin promoter-GFP transgene. The nestin promoter-GFP transgenic mouse expressed GFP under the regulatory element of nestin promoter and the second intron. B, The dentate gyrus of the nestin promoter-GFP mouse observed with the aid of a confocal microscope. C-F, The nestin immunostaining to the GFP-expressing cells with the process bearing GFAP. C, Merged image. D, GFP fluorescence; E, immunostaining for nestin; F, immunostaining for GFAP. The cell expressing nestin also expressed GFAP (arrows) and often comes in contact with blood vessels, which were also positively stained with anti-nestin (E; asterisk) as described previously (Palmer et al., 2000), but this blood vessel did not express GFP signal. G-R, The three sets of the confocal image (G-J, K-N, and O-R) demonstrating the nestin immunostaining to the GFP-expressing cells bearing PSA-NCAM proteins at their cell surface (arrowheads). The merged image is shown in G, K, O; GFP fluorescence is shown in H, L, P; the immunostaining for nestin protein is shown in I, M, Q; the immunostaining for PSA-NCAM is shown in J, N, R. Note that the cell surface areas of PSA-NCAM-bearing GFP-positive cells were positively stained with this anti-nestin antibody. Scale bars: B, 100 μm; _C_-R, 10 μm.
Figure 5.
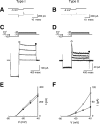
Electroresponsiveness of type I (lower IR) and type II (higher IR) GFP-positive cells in the DG. A, C, E, Results from type I cells; B, D, F, results from type II cells. A, B, Measurement of IR with a -5 mV square voltage pulse (above) from a holding potential around -70 mV. The steady-state current at the end of the hyperpolarizing command pulse was measured. Current traces (below) are averages of the responses to 100 consecutive pulses. C, D, Responses to a voltage step pulse indicated at the top of the panel. Four current traces are superimposed for each panel. Note that the vertical scales are different between C and D. E, F, Plot of the transmembrane current (ordinates) elicited by the voltage step pulses shown in C and D against the command voltage (abscissas). Open circles represent the values at the peak of the outward current (C, D); filled circles indicate the steady-state current values (C, D).
Figure 2.
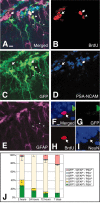
The BrdU pulse-chase examination on nestin-GFP transgenic mouse. A, The GFP-positive cell labeled with BrdU at the 2 hr time point. B-E, Separate image of A. B, Immunostaining for BrdU observed with rhodamine-conjugated anti-rat IgG antibody; C, immunostaining for GFP observed with Alexa488-conjugated anti-rabbit antibody; D, immunostaining for PSA-NCAM observed with Cy5-conjugated anti-mouse IgM antibody; E, immunostaining for GFAP observed with AMCA-conjugated anti-mouse IgG antibody. BrdU+/GFP+/GFAP-/PSA-NCAM+ cells are indicated with arrows. BrdU+/GFP+/GFAP +/PSA-NCAM- cells are indicated with arrowheads. F, A BrdU-labeled cell stained with a neuronal marker, NeuN (arrow), did not express GFP protein at the 7 d time point. NeuN was stained with Cy5-conjugated anti-mouse IgG antibody. J, Percentage of BrdU-labeled cells in the subgranular zone at the time point 2, 24, 72 hr, and 7 d after BrdU injection; 144 cells from three animals (48 per each animal) were calculated for each group. In J, error bars indicate SE. Scale bars: A, 10 μm; F, 5 μm.
Figure 3.
Visually guided patch-clamp recording from a cell expressing GFP in the adult DG of a nestin promoter-GFP mouse. A, Visual identification of a cell expressing GFP (arrow and arrowhead). B, Infrared DIC image of the slice. The cell in the center (arrow) was identified as GFP positive in A, and a patch pipette (seen from the left) was guided to the cell to establish the whole-cell configuration. C, Fluorescence image using the dye Alexa Fluor 568, which was spontaneously perfused from the patch pipette into the cell under recording. The wavelength of the excitation light used for the Alexa 568 was ∼568 nm, and emission was in the red. Note that the emitted fluorescence signal is absent in another GFP-positive cell that was not patch clamped (arrowhead). D, Overlapped image of A and C certifying that the patch-clamp recording was made from a GFP-positive cell. Scale bar, 10 μm.
Figure 4.
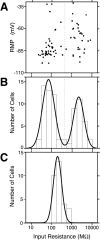
Bimodal distribution of input resistance in nestin-GFP-positive cells. A, Relationship between IR and RMP. Abscissa, IR in logarithmic scale; ordinate, RMP. Plot of results from a total of 74 GFP-positive cells. B, Distribution of IR of GFP-positive cells. Ordinate, number of cells. Abscissa, IR (same as A). The curve indicates the result of a nonlinear, least squares curve fitting of a double Gaussian distribution. The vertical broken line indicates the trough between two Gaussian peaks at ∼500 MΩ. C, Distribution of IR for GFP-negative mature neurons in the DG.
Figure 6.
Comparison of membrane currents among type I GFP-positive cells, type II GFP-positive cells, and GFP-negative mature neurons. A, D, Recordings and results from a type I cell. B, E, Recordings and results from a type II cell. C, F, Recordings and results from a mature GFP-negative granule neuron. A-C, Spontaneous recording of the membrane current recorded at a holding current of -70 mV. Note that mature granule neuron exhibits spontaneous EPSCs, whereas in the type II cell such spontaneous activity is absent. D-F, Responses to depolarizing voltage step pulses. The command voltage protocol is shown at the top of D and was the same for E and F. Pipette capacitance and series resistance were not compensated. No type I cells exhibited voltage-activated inward current (D). Note the expression of rapidly rising and rapidly inactivating inward currents (arrowhead) during depolarization in E, which is much smaller and slower than that in F (arrowhead). The voltage-dependent inward currents on type II GFP-positive cells were completely blocked by the addition of 1 μ
m
TTX (n = 10 of 10) (E). The values of IR and series resistance were monitored before and after these recordings (Fig.6 E). The last values of IR and series resistance were within 90-110% of the initial values.
Figure 7.
Relationship between process length and IR in GFP-positive cells. A, The length of the principal process with GFP signal was measured in all GFP-positive cells recorded using a fluorescence microscope with a high-sensitivity chilled CCD camera. Abscissa, IR in logarithmic scale; ordinate, process length. The maximum length was limited to 50 μm because of the measurement on the TV monitor of the fluorescence-sensitive CCD camera. Filled diamonds indicate data from type I cells; open diamonds indicate type II cells. B, C, Representative examples of the fluorescence image of a type I cell (B) and a type II cell (C). Note that the type I cell exhibits a process, whereas the type II cell does not. Also, note that the GFP fluorescence signal is weaker in type II cells, which was a commonly observed feature of these cells. Scale bar, 10 μm.
Figure 8.
Morphological features of type I and type II nestin-expressing cells examined using fluorescence imaging after injection of Lucifer yellow into the cell during the whole-cell patch-clamp recording. The slices were fixed after the recording, and the fluorescence was detected and visualized with a confocal scanning microscope. A, Type I cell; B, another type I cell; C, a type II cell; D, another type II cell; E, a GFP-negative typical astrocyte in dentate gyrus; F, a GFP-negative typical granule neuron in dentate gyrus. Note that type I cells (A, a small type I cell; B, a large type I cell) always extended their principal process toward the molecular layer as same as granule neurons of dentate gyrus (F), whereas the typical astrocytes extended their processes in all directions (Fig. 8 E). Type II cells extended their processes to the opposite side of (C) or tangentially to (D) the granule cell layer. Scale bars, 15 μm.
Figure 9.
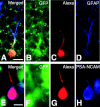
Expression of specific markers in type I and type II nestin-positive cells as confirmed by post-recording immunohistochemistry. Confocal microscopy images from slices in which a patch-clamp recording from a type I (IR = 36.0 MΩ) (A-D) and a type II (IR = 910 MΩ) (E-H) cell was made. A, Merged image of the images shown in B-D; B, GFP fluorescence; C, fluorescence image of Alexa Fluor 568 injected into the cell during whole-cell recording; D, immunostaining for GFAP observed with Cy5-conjugated anti-mouse IgG antibody, which was used to avoid cross-talk with other fluorescent emissions but shown in blue to demonstrate costaining with other dyes. E, Merged image of the images presented in F-H; F, GFP fluorescence (note the fluorescence intensity of this type II cell is weaker than the surrounding GFP-positive cells); G, fluorescence image of Alexa Fluor 568 injected into the cell during whole-cell recording; H, immunostaining for PSA-NCAM. Scale bars: _A_-D, 10 μm; _E_-H, 5 μm.
Figure 10.
A schematic diagram illustrating the two types of nestin-positive progenitors at an early stage of neurogenesis in adult dentate gyrus. Cell morphology was on the basis of the images of the recorded cells injected with fluorescence dye (Figs. 8, 9). The BrdU pulse-chase analysis (Fig. 2) strongly suggested that GFAP+ type I and PSA-NCAM+ type II would be early and late progenitors for newborn neurons at adult DG. SGZ, Subgranular zone; GCL, granular cell layer; ML, molecular layer.
Similar articles
- Seizures preferentially stimulate proliferation of radial glia-like astrocytes in the adult dentate gyrus: functional and immunocytochemical analysis.
Hüttmann K, Sadgrove M, Wallraff A, Hinterkeuser S, Kirchhoff F, Steinhäuser C, Gray WP. Hüttmann K, et al. Eur J Neurosci. 2003 Nov;18(10):2769-78. doi: 10.1111/j.1460-9568.2003.03002.x. Eur J Neurosci. 2003. PMID: 14656326 - Neural stem and progenitor cells in nestin-GFP transgenic mice.
Mignone JL, Kukekov V, Chiang AS, Steindler D, Enikolopov G. Mignone JL, et al. J Comp Neurol. 2004 Feb 9;469(3):311-24. doi: 10.1002/cne.10964. J Comp Neurol. 2004. PMID: 14730584 - GABAergic excitation promotes neuronal differentiation in adult hippocampal progenitor cells.
Tozuka Y, Fukuda S, Namba T, Seki T, Hisatsune T. Tozuka Y, et al. Neuron. 2005 Sep 15;47(6):803-15. doi: 10.1016/j.neuron.2005.08.023. Neuron. 2005. PMID: 16157276 - Neurogenesis in adult mammals: some progress and problems.
Gould E, Gross CG. Gould E, et al. J Neurosci. 2002 Feb 1;22(3):619-23. doi: 10.1523/JNEUROSCI.22-03-00619.2002. J Neurosci. 2002. PMID: 11826089 Free PMC article. Review. No abstract available. - Radial glial cells in the adult dentate gyrus: what are they and where do they come from?
Berg DA, Bond AM, Ming GL, Song H. Berg DA, et al. F1000Res. 2018 Mar 5;7:277. doi: 10.12688/f1000research.12684.1. eCollection 2018. F1000Res. 2018. PMID: 29568500 Free PMC article. Review.
Cited by
- Hippocampal neurogenesis in adult primates: a systematic review.
Elliott T, Liu KY, Hazan J, Wilson J, Vallipuram H, Jones K, Mahmood J, Gitlin-Leigh G, Howard R. Elliott T, et al. Mol Psychiatry. 2024 Nov 18. doi: 10.1038/s41380-024-02815-y. Online ahead of print. Mol Psychiatry. 2024. PMID: 39558003 - GluN2B on Adult-Born Granule Cells Modulates (R,S)-Ketamine's Rapid-Acting Effects in Mice.
Bulthuis NE, McGowan JC, Ladner LR, LaGamma CT, Lim SC, Shubeck CX, Brachman RA, Sydnor E, Pavlova IP, Seo DO, Drew MR, Denny CA. Bulthuis NE, et al. Int J Neuropsychopharmacol. 2024 Oct 1;27(10):pyae036. doi: 10.1093/ijnp/pyae036. Int J Neuropsychopharmacol. 2024. PMID: 39240140 Free PMC article. - Beyond amyloid and tau: rethinking Alzheimer's disease through less explored avenues.
Gyimesi M, Okolicsanyi RK, Haupt LM. Gyimesi M, et al. Open Biol. 2024 Jun;14(6):240035. doi: 10.1098/rsob.240035. Epub 2024 Jun 12. Open Biol. 2024. PMID: 38862019 Free PMC article. Review. - Emerging strategies for nerve repair and regeneration in ischemic stroke: neural stem cell therapy.
Wang S, He Q, Qu Y, Yin W, Zhao R, Wang X, Yang Y, Guo ZN. Wang S, et al. Neural Regen Res. 2024 Nov 1;19(11):2430-2443. doi: 10.4103/1673-5374.391313. Epub 2023 Dec 21. Neural Regen Res. 2024. PMID: 38526280 Free PMC article. - Exploring the Functional Heterogeneity of Directly Reprogrammed Neural Stem Cell-Derived Neurons via Single-Cell RNA Sequencing.
Kim YS, Seo N, Kim JH, Kang S, Park JW, Park KD, Lee HA, Park M. Kim YS, et al. Cells. 2023 Dec 11;12(24):2818. doi: 10.3390/cells12242818. Cells. 2023. PMID: 38132138 Free PMC article.
References
- Altman J, Das GD ( 1965) Autoradiographic and histological evidence of postnatal hippocampal neurogenesis in rats. J Comp Neurol 124: 319-335. - PubMed
- Altman J, Das GD ( 1967) Postnatal neurogenesis in the guinea-pig. Nature 214: 1098-1101. - PubMed
- Alvarez-Buylla A, Buskirk DR, Nottebohm F ( 1987) Monoclonal antibody reveals radial glia in adult avian brain. J Comp Neurol 264: 159-170. - PubMed
- Auerbach JM, Eiden MV, McKay RD ( 2000) Transplanted CNS stem cells form functional synapses in vivo. Eur J Neurosci 12: 1696-1704. - PubMed
- Blümcke I, Schewe JC, Normann S, Brüstle O, Schramm J, Elger CE, Wiestler OD ( 2001) Increase of nestin-immunoreactive neural precursor cells in the dentate gyrus of pediatric patients with early-onset temporal lobe epilepsy. Hippocampus 11: 311-321. - PubMed
Publication types
MeSH terms
Substances
LinkOut - more resources
Full Text Sources
Other Literature Sources
Molecular Biology Databases
