Regulation of TrkB receptor tyrosine kinase and its internalization by neuronal activity and Ca2+ influx - PubMed (original) (raw)
Regulation of TrkB receptor tyrosine kinase and its internalization by neuronal activity and Ca2+ influx
Jing Du et al. J Cell Biol. 2003.
Abstract
Internalization of the neurotrophin-Trk receptor complex is critical for many aspects of neurotrophin functions. The mechanisms governing the internalization process are unknown. Here, we report that neuronal activity facilitates the internalization of the receptor for brain-derived neurotrophic factor, TrkB, by potentiating its tyrosine kinase activity. Using three independent approaches, we show that electric stimulation of hippocampal neurons markedly enhances TrkB internalization. Electric stimulation also potentiates TrkB tyrosine kinase activity. The activity-dependent enhancement of TrkB internalization and its tyrosine kinase requires Ca2+ influx through N-methyl-d-aspartate receptors and Ca2+ channels. Inhibition of internalization had no effect on TrkB kinase, but inhibition of TrkB kinase prevents the modulation of TrkB internalization, suggesting a critical role of the tyrosine kinase in the activity-dependent receptor endocytosis. These results demonstrate an activity- and Ca2+-dependent modulation of TrkB tyrosine kinase and its internalization, and they provide new insights into the cell biology of tyrosine kinase receptors.
Figures
Figure 1.
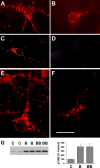
Effect of TBS on BDNF-receptor internalization, detected by BDNF-biotin imaging. (A and B) Detection of the internalized receptor–BDNF–biotin complex by Cy3-conjugated avidin. Hippocampal cultures were first incubated with BDNF-biotin on ice to achieve saturated binding, and then switched to 37°C for 30 min to allow receptor internalization. Many fluorescent puncta are seen in cultures incubated with BDNF-biotin (A), but not in those incubated with BDNF-biotin plus excess cold BDNF (B). (C and D) Blockade of BDNF-receptor internalization at low temperature. Confocal microscopy showing exclusive surface staining of BDNF-biotin when cultures were kept on ice (C). The staining was completely eliminated after acid wash (D). (E and F) Effect of TBS on the internalization of BDNF-biotin. Hippocampal neurons were incubated with BDNF-biotin, and stimulated with TBS in the presence (F) or absence (E) of activity blockers Cd2+ and Kyn. Bar, 10 μm. (G) Effect of BDNF-biotin on TrkB phosphorylation. Cultured hippocampal neurons were treated with or without recombinant BDNF (B) or BDNF-biotin (BB). C, no treatment. TrkB phosphorylation was detected by Western blot using an anti-pTrkB antibody specific for phosphor-Tyr490. (left) An example of Western blot; (right) summary of results (n = 4).
Figure 2.
Activity-dependent modulation of BDNF receptor internalization, measured by 125I-BDNF internalization. (A) 125I-BDNF binding assay. Surface binding is defined as acid-washable radioactivity, and internalization is the remaining radioactivity in the cells after the acid wash. Total and nonspecific (blockable by cold BDNF) binding and internalization of 125I-BDNF are shown. (B) Time courses of BDNF binding and internalization. Specific 125I-BDNF counts, which were obtained by subtracting the nonspecific counts from their respective total counts, are shown. (A and B) Error bars represent standard errors. (C) Effect of electric stimulation on 125I-BDNF internalization. The cultures were incubated with 125I-BDNF while various indicated stimuli were applied for 30 min, followed by acid wash. The data in control (no stimulation) are set as 0%, and the percentage of changes is presented. In this and all other experiments, data in a specific experimental condition were normalized to the mean in control. Results from several experiments were averaged and presented as mean ± SEM. The number associated with each column represents the number of experiments performed. (D) Role of neuronal activity or excitatory transmission. The stimulated and nonstimulated cultures were pretreated with or without TTX, or kynurenic acid (Kyn) for 30 min. All data are normalized to TBS-stimulated groups, which are set as 100%. #, Significantly different; P < 0.05, t test.
Figure 3.
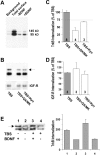
Effect of TBS on the internalization of TrkB, determined by surface biotinylation. Cell surface proteins were labeled by NHS-SS-biotin before initiation of TrkB internalization by BDNF at 37°C. The remaining biotin on surface proteins was removed by glutathione. The internalized TrkB was precipitated by streptavidin followed by Western blot using a TrkB antibody. (A) Detection of TrkB internalization by surface biotinylation. Both full-length (145 kD) and truncated (95 kD) TrkB receptors are observed. (Background) Internalization measured in cells debiotinylated without initiation of internalization; (Total surface) surface biotinylated TrkB measured in cells held on ice; (−BDNF) spontaneous TrkB internalization measured in the absence of BDNF; and (+BDNF) TrkB internalization induced by BDNF. (B) Enhancement of BDNF-induced TrkB internalization by TBS. Cultured hippocampal neurons were incubated with BDNF on ice to reach saturated receptor binding. Unbound BDNF was washed off, and surface proteins were labeled by NHS-SS-biotin. The cultures were moved to 37°C to initiate internalization while neurons were stimulated with TBS, with or without QX/MK or Kyn. The internalized membrane proteins were precipitated by immobilized avidin, blotted, and probed first with anti-TrkB antibodies, and then reprobed with anti–IGF1-R antibodies. (C) Quantification on full-length TrkB. The data were normalized to those of TBS stimulation alone (100%). (dashed line) Levels of TrkB internalization in cells not stimulated by TBS. The TBS group is significantly higher than the TBS + QX/MK and TBS + Kyn groups. P < 0.01, ANOVA followed by post-hoc test. (D) Quantification on IGF1-R using the same method as for TrkB. (E) Effect of TBS on ligand-independent internalization of TrkB. (left) An example of Western blot; (right) summary of results (n = 4). In the absence of the ligand (BDNF), TBS had no effect on the spontaneous internalization of TrkB (no significant difference between lanes 2 and 4). Results from several experiments were averaged and presented as mean ± SEM. The number associated with each column represents the number of experiments performed. (D and E) Data in a specific experimental condition were normalized to the mean in control. (B and E, arrow) Full-length TrkB.
Figure 4.
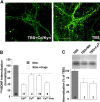
TrkB internalization in the absence of BDNF or Ca2 + influx. (A) Effect of TBS on BDNF receptor internalization in BDNF−/− neurons derived from BDNF knockout mice. BDNF−/− hippocampal neurons (cultured for 12 d) were stimulated with TBS in the presence (left) or absence (right) of activity blocker Cd2+ and Kyn. BDNF-biotin imaging assay similar to that shown in Fig. 1 was performed. Green color was assigned the fluorescent puncta representing internalized BDNF-biotin. Bar, 10 μm. (B) Role of Ca2+ influx in TrkB internalization measured by 125I-BDNF binding assay. Controls (TBS in regular medium) are set as 100%. Ca2+-free medium, Ca2+ channel blockers Cd2+ or Co2+, and NMDA receptor blocker MK801 (MK) all inhibited internalization (P < 0.001, ANOVA). (C) Role of Ca2+ influx in TrkB internalization measured by the biotinylation assay. Significantly less internalized TrkB receptors were detected in cultures stimulated with TBS in the presence of MK801 or Cd2+ (P < 0.05, ANOVA). (B and C, dashed line) Levels of TrkB internalization in cells not stimulated by TBS. Results from several experiments were averaged and presented as mean ± SEM. The number associated with each column represents the number of experiments performed.
Figure 5.
Regulation of TrkB tyrosine phosphorylation. TrkB phosphorylation was detected by an anti-pTrkB antibody specific for phosphor-Tyr490. (A) Enhancement of TrkB phosphorylation by TBS. 2 nM BDNF was applied to the cultures under various conditions indicated for 15 min, and cells were harvested for pTrkB assay. (top) A sample Western blot; (bottom) quantification of pTrkB based on six to seven experiments. # and *, significantly lower and higher than control, respectively. P < 0.01, ANOVA plus post-hoc. (B) Loading control of the TrkB phosphorylation assay. Blots were reprobed with an anti-TrkB antibody, and signals for pTrkB were normalized to those for total TrkB signal on a lane-by-lane basis. Quantifications are shown below the blots (n = 4 for both experiments). (CM) CNQX + MK801. (C) Time course of TrkB phosphorylation induced by 1 nM BDNF application. (D) Dose–response relationship. TrkB phosphorylation was measured 15 min after the application of various concentrations of BDNF. (E) TBS-induced increase in TrkB phosphorylation is not due to an enhanced TrkB surface expression. Hippocampal neurons were pretreated with BDNF on ice, extensively washed, and then switched to 37°C to allow kinase activation. Cells were harvested 15 min later for TrkB phosphorylation assay. #, Significantly different; P < 0.05, t test.
Figure 6.
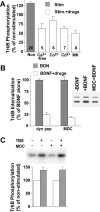
TrkB phosphorylation in the absence of Ca2 + influx or TrkB internalization. (A) Regulation of TrkB phosphorylation by Ca2+ influx. pTrkB in nonstimulated condition in regular medium were set as 100%. Ca2+-free medium, Ca2+ blockers Cd2+ or Co2+, and NMDA receptor blocker MK801 all significantly inhibit TrkB phosphorylation compared with TBS alone. P < 0.001, ANOVA plus post-hoc. Results from several experiments were averaged and presented as mean ± SEM. The number associated with each column represents the number of experiments performed. (B) Effect of MDC on TrkB internalization. Cultures were treated with or without MDC for 15 min, and TrkB internalization was measured by biotinylation assay. (right) Example showing MDC blocks the BDNF-induced TrkB internalization; (histogram) relative effects of dynamin proline-rich domain peptide (dyn pep) and MDC. MDC appears to be just as effective in blocking TrkB internalization as dyn pep, which is known to block clathrin-mediated endocytosis. (C) Effect of MDC on TrkB tyrosine kinase. Cultures were treated with or without MDC for 15 min. BDNF was applied and cells were harvested 15 min later for pTrkB assay (n = 7 in all conditions).
Figure 7.
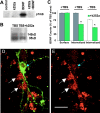
Role of tyrosine kinase in activity-dependent modulation of TrkB internalization. (A) Inhibition of TrkB phosphorylation by k252a. k252a was applied 1 h before BDNF application, and the hippocampal cultures were harvested 15 min later to measure TrkB phosphorylation. (B) Inhibition of TrkB internalization by k252a. Hippocampal cultures were pretreated with or without 0.2 μM k252a, and internalized TrkB was measured by biotinylation assay with or without TBS (n = 5–7). (C) Attenuation of BDNF receptor internalization, but not on surface binding, by k252a. Binding and internalization assays were performed in cultures stimulated with or without TBS and averaged counts for binding and internalization in TBS-stimulated cultures were set as 100% (gray bars). The data from nonstimulated cultures were normailzed to the stimulated cultures (white bars); n = 12 for TBS-stimulated cultures, and n = 4 for nonstimulated cultures. *, P < 0.001, t test. (D and E) Inhibition of TrkB internalization by dominant-negative TrkB (TrkBkd). Hippocampal neurons were transfected with TrkBkd tagged with a myc indicator. Internalization was visualized by BDNF-biotin. (D) The superimposed image of a TrkBkd-transfected cell (green, detected by an anti-myc antibody) and cells that internalized BDNF-biotin (red). (E) The same image as D with BDNF-biotin staining only. White arrows indicate TrkBkd negative neurons; blue arrows indicate a TrkBkd- positive cell. Note the difference in BDNF-biotin fluorescence spots between these two types of cells. Bar, 20 μm.
Similar articles
- Activity- and Ca(2+)-dependent modulation of surface expression of brain-derived neurotrophic factor receptors in hippocampal neurons.
Du J, Feng L, Yang F, Lu B. Du J, et al. J Cell Biol. 2000 Sep 18;150(6):1423-34. doi: 10.1083/jcb.150.6.1423. J Cell Biol. 2000. PMID: 10995446 Free PMC article. - BDNF potentiates spontaneous Ca2+ oscillations in cultured hippocampal neurons.
Sakai N, Yamada M, Numakawa T, Ogura A, Hatanaka H. Sakai N, et al. Brain Res. 1997 Dec 19;778(2):318-28. doi: 10.1016/s0006-8993(97)01052-4. Brain Res. 1997. PMID: 9459549 - Neurotrophins stimulate chemotaxis of embryonic cortical neurons.
Behar TN, Dugich-Djordjevic MM, Li YX, Ma W, Somogyi R, Wen X, Brown E, Scott C, McKay RD, Barker JL. Behar TN, et al. Eur J Neurosci. 1997 Dec;9(12):2561-70. doi: 10.1111/j.1460-9568.1997.tb01685.x. Eur J Neurosci. 1997. PMID: 9517461 - The Trk family of neurotrophin receptors.
Barbacid M. Barbacid M. J Neurobiol. 1994 Nov;25(11):1386-403. doi: 10.1002/neu.480251107. J Neurobiol. 1994. PMID: 7852993 Review. - Regulation of TrkB cell surface expression-a mechanism for modulation of neuronal responsiveness to brain-derived neurotrophic factor.
Andreska T, Lüningschrör P, Sendtner M. Andreska T, et al. Cell Tissue Res. 2020 Oct;382(1):5-14. doi: 10.1007/s00441-020-03224-7. Epub 2020 Jun 15. Cell Tissue Res. 2020. PMID: 32556728 Free PMC article. Review.
Cited by
- Long-term adeno-associated viral vector-mediated expression of truncated TrkB in the adult rat facial nucleus results in motor neuron degeneration.
De Wit J, Eggers R, Evers R, Castrén E, Verhaagen J. De Wit J, et al. J Neurosci. 2006 Feb 1;26(5):1516-30. doi: 10.1523/JNEUROSCI.4543-05.2006. J Neurosci. 2006. PMID: 16452675 Free PMC article. - Minocycline attenuates the development of diabetic neuropathy by modulating DREAM and BDNF protein expression in rat spinal cord.
Ismail CAN, Suppian R, Aziz CBA, Long I. Ismail CAN, et al. J Diabetes Metab Disord. 2019 May 18;18(1):181-190. doi: 10.1007/s40200-019-00411-4. eCollection 2019 Jun. J Diabetes Metab Disord. 2019. PMID: 31275889 Free PMC article. - Brain-derived neurotrophic factor and cocaine addiction.
McGinty JF, Whitfield TW Jr, Berglind WJ. McGinty JF, et al. Brain Res. 2010 Feb 16;1314:183-93. doi: 10.1016/j.brainres.2009.08.078. Epub 2009 Sep 2. Brain Res. 2010. PMID: 19732758 Free PMC article. Review. - TrkB as a potential synaptic and behavioral tag.
Lu Y, Ji Y, Ganesan S, Schloesser R, Martinowich K, Sun M, Mei F, Chao MV, Lu B. Lu Y, et al. J Neurosci. 2011 Aug 17;31(33):11762-71. doi: 10.1523/JNEUROSCI.2707-11.2011. J Neurosci. 2011. PMID: 21849537 Free PMC article. - Activation of adenosine A2A receptors induces TrkB translocation and increases BDNF-mediated phospho-TrkB localization in lipid rafts: implications for neuromodulation.
Assaife-Lopes N, Sousa VC, Pereira DB, Ribeiro JA, Chao MV, Sebastião AM. Assaife-Lopes N, et al. J Neurosci. 2010 Jun 23;30(25):8468-80. doi: 10.1523/JNEUROSCI.5695-09.2010. J Neurosci. 2010. PMID: 20573894 Free PMC article. Retracted.
References
- Atwal, J.K., B. Massie, F.D. Miller, and D.R. Kaplan. 2000. The TrkB-Shc site signals neuronal survival and local axon growth via MEK and P13-kinase. Neuron. 27:265–277. - PubMed
- Berg, M.M., D.W. Sternberg, L.F. Parada, and M.V. Chao. 1992. K-252a inhibits nerve growth factor-induced trk proto-oncogene tyrosine phosphorylation and kinase activity. J. Biol. Chem. 267:13–16. - PubMed
Publication types
MeSH terms
Substances
LinkOut - more resources
Full Text Sources
Molecular Biology Databases
Miscellaneous
