Lytic versus stimulatory synapse in cytotoxic T lymphocyte/target cell interaction: manifestation of a dual activation threshold - PubMed (original) (raw)
Lytic versus stimulatory synapse in cytotoxic T lymphocyte/target cell interaction: manifestation of a dual activation threshold
Mustapha Faroudi et al. Proc Natl Acad Sci U S A. 2003.
Abstract
Activation of biological functions in T lymphocytes is determined by the molecular dynamics occurring at the T cell/opposing cell interface. In the present study, a central question of cytotoxic T lymphocyte (CTL) biology was studied at the single-cell level: can two distinct activation thresholds for cytotoxicity and cytokine production be explained by intercellular molecular dynamics between CTLs and targets? In this study, we combine morphological approaches with numerical analysis, which allows us to associate specific patterns of calcium mobilization with different biological responses. We show that CTLs selectively activated to cytotoxicity lack a mature immunological synapse while exhibiting a low threshold polarized secretion of lytic granules and spike-like patterns of calcium mobilization. This finding is contrasted by fully activated CTLs, which exhibit a mature immunological synapse and smooth and sustained calcium mobilization. Our results indicate that intercellular molecular dynamics and signaling characteristics allow the definition of two activation thresholds in individual CTLs: one for polarized granule secretion (lytic synapse formation) and the other for cytokine production (stimulatory synapse formation).
Figures
Fig. 5.
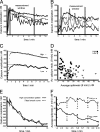
Spiky signaling in CTLs stimulated with low antigen concentration. (A and B) Typical calcium mobilization patterns are depicted: high concentration patterns (A) and low concentration patterns (B). (C) The ensemble average of the calcium flux over time is shown. (D) The correlation of spikiness and mean calcium flux is shown. (E) An examplatory fitting of a smooth curve to a time series is given. (F) The temporal evolution of the ensemble average of the signal pattern spikiness is depicted for both specific peptide concentrations.
Fig. 1.
IFN-γ production and TCR down-regulation require a higher antigen concentration than cytotoxicity. CTLs were conjugated with target cells in the presence of different concentrations of pp65. Cytotoxicity (□), IFN-γ production (▵), and CD3 down-regulation (•) were measured after 4 h at 37°C. The effector-to-target cell ratio (E/T ratio) was 2:1 in the presented experiments. Similar results were obtained by using other E/T ratios (6:1, 0.6:1, 0.2:1). Data are from three independent experiments performed in duplicate for each assay. Results are expressed as means ± SD of the three experiments.
Fig. 2.
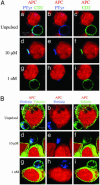
IS formation is not required for CTL polarization toward target cells. CTLs were conjugated with EBV-B cells (red). After 10 min at 37°C cells were stained with the following antibodies. (A) Antiphosphotyrosine mAb (blue) and anti-CD2 mAb (green). (B) Antiperforin mAb (blue) and antitubulin mAb (green). APCs were either unpulsed (a–c) or pulsed with either 10 μM(d–f)or 1 nM (g–i) pp65. a, d, and g are three-color images. In b, e, and h the green color has been removed. In c, f, and i the blue color has been removed. Data are from one representative experiment of six. (Bars = 5 μM.)
Fig. 3.
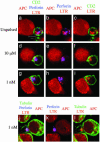
Reorientation of CTL lytic machinery in the absence of CD2 enrichment at the cell–cell contact site. T cells were pretreated with LTR before conjugation with target cells unpulsed (a–c) or pulsed with either 10 μM(d–f) or1nM(g–l) pp65. After 10 min at 37°C cells were stained with either anti-CD2 mAbs (green) and antiperforin mAbs (blue) (a–i) or antitubulin mAbs (green) and anti-perforin mAbs (blue) (j–l). a, d, g, and j are three-color images. In b, e, h, and k the green color has been removed. In c, f, i, and l the blue color has been removed. Data are from one representative experiment of three. (Bar = 5 μM.)
Fig. 4.
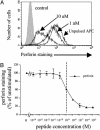
Antigen dose-dependent decrease of perforin intracellular content in CTLs. (A) Staining for perforin in CTLs that have been conjugated for 2 h with EBV-B cell unpulsed or pulsed with either 10 μM or 1 nM pp65. (B) Levels of perforin staining as a function of antigen concentration. Data are from three independent experiments performed in duplicate. Results are expressed as means ± SD of the three experiments.
Comment in
- Function-specific variations in the immunological synapses formed by cytotoxic T cells.
Irvine DJ. Irvine DJ. Proc Natl Acad Sci U S A. 2003 Nov 25;100(24):13739-40. doi: 10.1073/pnas.2536626100. Epub 2003 Nov 17. Proc Natl Acad Sci U S A. 2003. PMID: 14623966 Free PMC article. No abstract available.
Similar articles
- Peptide modification or blocking of CD8, resulting in weak TCR signaling, can activate CTL for Fas- but not perforin-dependent cytotoxicity or cytokine production.
Kessler B, Hudrisier D, Schroeter M, Tschopp J, Cerottini JC, Luescher IF. Kessler B, et al. J Immunol. 1998 Dec 15;161(12):6939-46. J Immunol. 1998. PMID: 9862728 - Centrosome polarization delivers secretory granules to the immunological synapse.
Stinchcombe JC, Majorovits E, Bossi G, Fuller S, Griffiths GM. Stinchcombe JC, et al. Nature. 2006 Sep 28;443(7110):462-5. doi: 10.1038/nature05071. Nature. 2006. PMID: 17006514 - Expression and function of synaptotagmin VII in CTLs.
Fowler KT, Andrews NW, Huleatt JW. Fowler KT, et al. J Immunol. 2007 Feb 1;178(3):1498-504. doi: 10.4049/jimmunol.178.3.1498. J Immunol. 2007. PMID: 17237398 Free PMC article. - The binding and lysis of target cells by cytotoxic lymphocytes: molecular and cellular aspects.
Berke G. Berke G. Annu Rev Immunol. 1994;12:735-73. doi: 10.1146/annurev.iy.12.040194.003511. Annu Rev Immunol. 1994. PMID: 8011296 Review. - The secretory synapse: the secrets of a serial killer.
Bossi G, Trambas C, Booth S, Clark R, Stinchcombe J, Griffiths GM. Bossi G, et al. Immunol Rev. 2002 Nov;189:152-60. doi: 10.1034/j.1600-065x.2002.18913.x. Immunol Rev. 2002. PMID: 12445272 Review.
Cited by
- Attenuating CD3 affinity in a PSMAxCD3 bispecific antibody enables killing of prostate tumor cells with reduced cytokine release.
Dang K, Castello G, Clarke SC, Li Y, Balasubramani A, Boudreau A, Davison L, Harris KE, Pham D, Sankaran P, Ugamraj HS, Deng R, Kwek S, Starzinski A, Iyer S, van Schooten W, Schellenberger U, Sun W, Trinklein ND, Buelow R, Buelow B, Fong L, Dalvi P. Dang K, et al. J Immunother Cancer. 2021 Jun;9(6):e002488. doi: 10.1136/jitc-2021-002488. J Immunother Cancer. 2021. PMID: 34088740 Free PMC article. - Design of a Trispecific Checkpoint Inhibitor and Natural Killer Cell Engager Based on a 2 + 1 Common Light Chain Antibody Architecture.
Bogen JP, Carrara SC, Fiebig D, Grzeschik J, Hock B, Kolmar H. Bogen JP, et al. Front Immunol. 2021 May 10;12:669496. doi: 10.3389/fimmu.2021.669496. eCollection 2021. Front Immunol. 2021. PMID: 34040611 Free PMC article. - Plasmodium cellular effector mechanisms and the hepatic microenvironment.
Frevert U, Krzych U. Frevert U, et al. Front Microbiol. 2015 May 27;6:482. doi: 10.3389/fmicb.2015.00482. eCollection 2015. Front Microbiol. 2015. PMID: 26074888 Free PMC article. Review. - Ultrarapid lytic granule release from CTLs activates Ca2+-dependent synaptic resistance pathways in melanoma cells.
Filali L, Puissegur MP, Cortacero K, Cussat-Blanc S, Khazen R, Van Acker N, Frenois FX, Abreu A, Lamant L, Meyer N, Vergier B, Müller S, McKenzie B, Valitutti S. Filali L, et al. Sci Adv. 2022 Feb 18;8(7):eabk3234. doi: 10.1126/sciadv.abk3234. Epub 2022 Feb 16. Sci Adv. 2022. PMID: 35171665 Free PMC article. - The virus-immunity ecosystem.
Doherty PC, Turner SJ. Doherty PC, et al. Arch Virol Suppl. 2005;(19):17-32. doi: 10.1007/3-211-29981-5_3. Arch Virol Suppl. 2005. PMID: 16355866 Free PMC article. Review.
References
- Kagi, D., Vignaux, F., Ledermann, B., Burki, K., Depraetere, V., Nagata, S., Hengartner, H. & Golstein, P. (1994) Science 265, 528–530. - PubMed
- Lowin, B., Hahne, M., Mattmann, C. & Tschopp, J. (1994) Nature 370, 650–652. - PubMed
- Sykulev, Y., Joo, M., Vturina, I., Tsomides, T. J. & Eisen, H. N. (1996) Immunity 4, 565–571. - PubMed
- Sanderson, C. J. (1976) Proc. R. Soc. London Ser. B 192, 241–255. - PubMed
- Isaaz, S., Baetz, K., Olsen, K., Podack, E. & Griffiths, G. M. (1995) Eur. J. Immunol. 25, 1071–1079. - PubMed
Publication types
MeSH terms
Substances
LinkOut - more resources
Full Text Sources
Other Literature Sources


