Cell size as a link between noncoding DNA and metabolic rate scaling - PubMed (original) (raw)
Cell size as a link between noncoding DNA and metabolic rate scaling
J Kozłowski et al. Proc Natl Acad Sci U S A. 2003.
Abstract
Accumulation of noncoding DNA and therefore genome size (C-value) may be under strong selection toward increase of body size accompanied by low metabolic costs. C-value directly affects cell size and specific metabolic rate indirectly. Body size can enlarge through increase of cell size and/or cell number, with small cells having higher metabolic rates. We argue that scaling exponents of interspecific allometries of metabolic rates are by-products of evolutionary diversification of C-values within narrow taxonomic groups, which underlines the participation of cell size and cell number in body size optimization. This optimization leads to an inverse relation between slopes of interspecific allometries of metabolic rates and C-value. To test this prediction we extracted literature data on basal metabolic rate (BMR), body mass, and C-value of mammals and birds representing six and eight orders, respectively. Analysis of covariance revealed significant heterogeneity of the allometric slopes of BMR and C-value in both mammals and birds. As we predicted, the correlation between allometric exponents of BMR and C-value was negative and statistically significant among mammalian and avian orders.
Figures
Fig. 1.
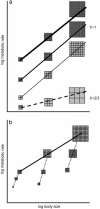
(a) The relation between body size and metabolic rate in hypothetical lineages originating from species of similar body size. The uppermost solid line connects hypothetical adult representatives of three species belonging to a lineage. Their body masses are approximated as sums of equal-sized cells depicted as small squares. In this lineage the increase in body size has been realized entirely through an increase of cell number. The second and third (from top) solid lines represent lineages also increasing body size exclusively through cell number increase, but having lower cell membrane permeability (medium solid line) or having larger cells (thin solid line). Both lower cell membrane permeability and larger cells result in lower metabolic costs of maintenance of ionic gradients, and hence a lower metabolic rate reflected in a lower intercept. All three solid lines have a slope ≈1. The dashed line represents a lineage increasing body size entirely through cell size expansion; the allometric slope equals 2/3 if the metabolic rate of larger cells decreases according to the surface-to-volume ratio. (b) Illustration of the difference between the concepts of within-lineage (solid line) and ontogenetic (dashed lines) scaling of metabolic rate. BMR (reflecting metabolic costs of tissue maintenance, but not metabolic costs of tissue production) should scale in ontogenesis with the slope ≈1.
Fig. 2.
Interspecific allometries resulting from body size optimization in lineages differing in their slopes for the dependence of metabolic rate on body size dictated by cell size. (a) Thin black lines depict within-lineage scaling of metabolic rate according to the equation R(w) = 0.015 wb, where b changes from 0.75 to 1.0, which gives the average 0.875; optimal body sizes were calculated with condition 1, assuming that energy acquisition scales as A(w) = 0.05 w.67 and mortality rate scales as m(w) = 0.0015 _w_–.1 (blue points), m(w) = 0.0015 _w_0 (orange points), or m(w) = 0.0015 w.1 (red points). Blue points can be well approximated by a straight line with slope 0.67, orange points by a line with slope 0.64, and red points by a line with slope 0.61. These slopes represent interspecific allometries for metabolic rate. Note that all these slopes are much lower than the average within-lineage slope. (b) The same picture as in a, after the lines for within-lineage slopes are removed, and all points for optimal body size are represented with the same color; points are approximated with a common regression line having slope 0.67. Note that the points resemble real data analyzed by students of interspecific allometries for metabolic rate: they do not know the within-lineage slopes for metabolic rate for particular species, and usually they are not aware that the group of species may be nonuniform with respect to other parameters. (c) Like a (after the lines for within-species metabolic rate are removed), but with the resource acquisition rate scaling as 0.05 w.66 (blue points), 0.05 w.58 (orange points), or 0.05 w.50 (red points), and mortality rate as 0.0015 _w_–.10. Slopes for interspecific allometries are 0.66, 0.62, and 0.60, respectively, and the common slope is 0.73. (d) Data points from a and c, supplemented with points obtained by changing the intercepts of the resource acquisition and mortality rate functions. Common slope is 0.74.
Fig. 3.
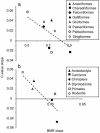
Correlation between values of slopes of allometric scaling of BMR and C-values with body mass among eight orders of birds (a) and six orders of mammals (b). Broken lines are type II least-square regressions indicating trends.
Similar articles
- The relationship between body mass and field metabolic rate among individual birds and mammals.
Hudson LN, Isaac NJ, Reuman DC. Hudson LN, et al. J Anim Ecol. 2013 Sep;82(5):1009-20. doi: 10.1111/1365-2656.12086. Epub 2013 May 23. J Anim Ecol. 2013. PMID: 23701213 Free PMC article. - Scaling of basal metabolic rate with body mass and temperature in mammals.
Clarke A, Rothery P, Isaac NJ. Clarke A, et al. J Anim Ecol. 2010 May;79(3):610-9. doi: 10.1111/j.1365-2656.2010.01672.x. Epub 2010 Feb 18. J Anim Ecol. 2010. PMID: 20180875 - Phenotypic plasticity in the scaling of avian basal metabolic rate.
McKechnie AE, Freckleton RP, Jetz W. McKechnie AE, et al. Proc Biol Sci. 2006 Apr 22;273(1589):931-7. doi: 10.1098/rspb.2005.3415. Proc Biol Sci. 2006. PMID: 16627278 Free PMC article. - Allometric scaling of mammalian metabolism.
White CR, Seymour RS. White CR, et al. J Exp Biol. 2005 May;208(Pt 9):1611-9. doi: 10.1242/jeb.01501. J Exp Biol. 2005. PMID: 15855392 Review. - Allometric scaling of maximal metabolic rate in mammals: muscle aerobic capacity as determinant factor.
Weibel ER, Bacigalupe LD, Schmitt B, Hoppeler H. Weibel ER, et al. Respir Physiol Neurobiol. 2004 May 20;140(2):115-32. doi: 10.1016/j.resp.2004.01.006. Respir Physiol Neurobiol. 2004. PMID: 15134660 Review.
Cited by
- Quantification of cell size using temporal diffusion spectroscopy.
Jiang X, Li H, Xie J, Zhao P, Gore JC, Xu J. Jiang X, et al. Magn Reson Med. 2016 Mar;75(3):1076-85. doi: 10.1002/mrm.25684. Epub 2015 Apr 4. Magn Reson Med. 2016. PMID: 25845851 Free PMC article. - Comparison of metabolic scaling between triploid and diploid common carp.
Zhu Y, Xiong W, Xu Y, Zhang P, Zhang J, Luo Y. Zhu Y, et al. J Comp Physiol B. 2021 Jul;191(4):711-719. doi: 10.1007/s00360-021-01365-x. Epub 2021 Apr 3. J Comp Physiol B. 2021. PMID: 33811547 - The Effect of Oxygen Limitation on a Xylophagous Insect's Heat Tolerance Is Influenced by Life-Stage Through Variation in Aerobic Scope and Respiratory Anatomy.
Javal M, Thomas S, Lehmann P, Barton MG, Conlong DE, Du Plessis A, Terblanche JS. Javal M, et al. Front Physiol. 2019 Nov 20;10:1426. doi: 10.3389/fphys.2019.01426. eCollection 2019. Front Physiol. 2019. PMID: 31824337 Free PMC article. - Solving the grand challenge of phenotypic integration: allometry across scales.
Vasseur F, Westgeest AJ, Vile D, Violle C. Vasseur F, et al. Genetica. 2022 Aug;150(3-4):161-169. doi: 10.1007/s10709-022-00158-6. Epub 2022 Jul 20. Genetica. 2022. PMID: 35857239 Free PMC article. - Hematological convergence between Mesozoic marine reptiles (Sauropterygia) and extant aquatic amniotes elucidates diving adaptations in plesiosaurs.
Fleischle CV, Sander PM, Wintrich T, Caspar KR. Fleischle CV, et al. PeerJ. 2019 Nov 19;7:e8022. doi: 10.7717/peerj.8022. eCollection 2019. PeerJ. 2019. PMID: 31763069 Free PMC article.
References
- Cavalier-Smith, T. (1982) Annu. Rev. Biophys. Bioengin. 11, 273–302. - PubMed
- Gregory, T. R. (2001) Biol. Rev. 76, 65–101. - PubMed
- Kidwell, M. G. & Lisch, D. R. (2001) Evolution (Lawrence, Kans.) 55, 1–24. - PubMed
- Pagel, M. & Johnstone, R. A. (1992) Proc. R. Soc. London Ser. B 249, 119–124. - PubMed
- Szarski, H. (1970) Nature 226, 651–652. - PubMed
Publication types
MeSH terms
Substances
LinkOut - more resources
Full Text Sources
Research Materials


