SOCS-3 is frequently silenced by hypermethylation and suppresses cell growth in human lung cancer - PubMed (original) (raw)
SOCS-3 is frequently silenced by hypermethylation and suppresses cell growth in human lung cancer
Biao He et al. Proc Natl Acad Sci U S A. 2003.
Abstract
Lung cancer is the leading cause of cancer death in the world, but the molecular mechanisms for its development have not been well characterized. The suppressors of cytokine signaling (SOCS) are inhibitors of cytokine signaling that function via the Janus kinase (JAK)/signal transducers and activators of transcription (STAT) pathway. Eight SOCS proteins with similar structures have been identified so far. SOCS family members, however, have distinct mechanisms of inhibition of JAK/STAT signaling. Abnormalities of the JAK/STAT pathway are associated with cancer. Inhibition of signaling results in growth suppression in various cell types. Recently, the involvement of SOCS-1 in carcinogenesis has been reported. Here, we report identification of frequent hypermethylation in CpG islands of the functional SOCS-3 promoter that correlates with its transcription silencing in cell lines (lung cancer, breast cancer, and mesothelioma) and primary lung cancer tissue samples. Restoration of SOCS-3 in lung cancer cells where SOCS-3 was methylation-silenced resulted in the down-regulation of active STAT3, induction of apoptosis, and growth suppression. Our results suggest that methylation silencing of SOCS-3 is one of the important mechanisms of constitutive activation of the JAK/STAT pathway in cancer pathogenesis. The data also suggest that SOCS-3 therapy may be useful in the treatment of cancer.
Figures
Fig. 1.
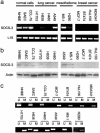
Correlation of methylation in the promoter region with silencing of the SOCS-3 gene in cell lines. (a) RT-PCR results from four NSCLC cells, two mesothelioma cells, four breast cancer cell lines, and three normal cells. The fragment of human SOCS-3 cDNA amplified is 579 bp. A 395-bp fragment of the L19 ribosomal protein gene is used as a positive control for RNA quality and loading. (b) Western analysis of SOCS-3 protein in cancer cell lines and normal controls. β-Actin protein was used as loading control. (c) MSP analysis of cell lines. Bands (298 bp) in lanes labeled “U” are unmethylated DNA product amplified with unmethylation-specific primers. Bands (268 bp) in lanes labeled “M” are methylated DNA product amplified with methylation-specific primers.
Fig. 2.
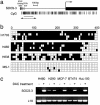
(a) A scheme of the 5′ SOCS-3 promoter region and SOCS-3 gene. The large black bar represents the ORF of SOCS-3 gene with an arrow on top indicating the translation start site. The location of two STAT-binding sites and one TATA box in the SOCS-3 promoter region is indicated. Vertical bars represent CpG islands. The line and double arrow below the CpG islands represent regions analyzed by MSP and bisulfite sequencing, respectively. (b) Bisulfite-sequencing analysis of cell lines. Open and filled squares represent unmethylated and methylated CpG islands, respectively. We sequenced four clones of PCR products amplified from bisulfite-treated genomic DNA for each cell line. (c) Reactivation of SOCS-3 expression by 5-aza-2′-deoxycytidine (DAC) treatment in cell lines. RT-PCR was performed after DAC treatment (1.0 μM for 96 h). A 395-bp fragment of the L19 ribosomal protein gene was used as a control for RNA quality and loading.
Fig. 3.
Correlation of methylation in the promoter region with silencing of the SOCS-3 gene in primary NSCLC tissue samples. (a) Northern blot of eight matched pairs of normal and lung cancer tissue probed with SOCS-3 cDNA. A specific probe of L19 ribosomal protein was used as a standard. (b) MSP analysis of eight matched pairs of normal (N) and lung cancer (T) tissue. Bands in lanes U and M are as indicated in Fig. 1_c_.
Fig. 4.
Methylation analysis of additional NSCLC primary tissue samples. (a) Bisulfite-sequencing examples of the SOCS-3 promoter region in NSCLC primary tissue samples. Open and filled squares represent unmethylated and methylated CpG islands, respectively. We sequenced four clones of PCR products amplified from bisulfite-treated genomic DNA for each sample. The region analyzed is as indicated in Fig. 2_a_. (b) Summary of methylation status of the SOCS-3 promoter region in 18 NSCLC primary tissue samples. The gene name is indicated on the left, and case numbers are indicated at the top. Each gray (methylation) or open (no methylation) square represents a primary tumor.
Fig. 5.
Growth suppression in NSCLC cells by restoration of the SOCS-3 gene. (a and b) Morphology of H460 cells (SOCS-3 methylation-silenced) after transfection of empty vector or SOCS-3 expression vector and subsequent selection with G418 for 1 wk, respectively. (c) Percentage of live H460 cells after transfection of empty vector or SOCS-3 expression vector and subsequent selection with G418 for 1 wk. Results are means with error bars (SD). (d) Example of apoptotic analysis using flow cytometry on H460 cells 1 wk after transfection of empty vector or SOCS-3 expression vector. FL1-H represents annexin V-FITC staining. (e) Western analysis of endogenous phosphorylated STAT3 (active form) and SOCS-3 proteins in H460 cells after transfection of empty vector or SOCS-3 expression vector. β-Actin was used as loading control. Whole-cell extracts were prepared after transfection and selection with G418 for 4 wk. (f) Colony formation assay using H460 cells. The cells were transfected with empty vector or SOCS-3 expression vector and selected with G418 for 4 wk. The bar graph shows the average of colony numbers in triplicate experiments. Error bars are SD.
Fig. 6.
Transfection of SOCS-3 construct into cell line MS-1 where the SOCS-3 promoter is not methylated. (a) Graph of apoptotic analysis using flow cytometry on MS-1 cells 1 wk after transfection of empty vector or SOCS-3 expression vector. (b) Western analysis of endogenous phosphorylated STAT3 and SOCS-3 proteins in MS-1 cells after transfection of empty vector or SOCS-3 expression vector. β-Actin was used as loading control. Whole-cell extracts were prepared after transfection and selection with G418 for 3 wk. (c) Colony formation assay using MS-1 cells. The bar graph shows the average of colony numbers in triplicate experiments. Error bars are SD. The cells were transfected with empty vector or SOCS-3 expression vector and selected with G418 for 3 wk.
Similar articles
- Activity of the suppressor of cytokine signaling-3 promoter in human non-small-cell lung cancer.
He B, You L, Xu Z, Mazieres J, Lee AY, Jablons DM. He B, et al. Clin Lung Cancer. 2004 May;5(6):366-70. doi: 10.3816/CLC.2004.n.015. Clin Lung Cancer. 2004. PMID: 15217536 - Methylation silencing of SOCS-3 promotes cell growth and migration by enhancing JAK/STAT and FAK signalings in human hepatocellular carcinoma.
Niwa Y, Kanda H, Shikauchi Y, Saiura A, Matsubara K, Kitagawa T, Yamamoto J, Kubo T, Yoshikawa H. Niwa Y, et al. Oncogene. 2005 Sep 22;24(42):6406-17. doi: 10.1038/sj.onc.1208788. Oncogene. 2005. PMID: 16007195 - SOCS-3 is frequently methylated in head and neck squamous cell carcinoma and its precursor lesions and causes growth inhibition.
Weber A, Hengge UR, Bardenheuer W, Tischoff I, Sommerer F, Markwarth A, Dietz A, Wittekind C, Tannapfel A. Weber A, et al. Oncogene. 2005 Oct 6;24(44):6699-708. doi: 10.1038/sj.onc.1208818. Oncogene. 2005. PMID: 16007169 - Suppressors of cytokine signalling (SOCS): putative modulators of cytokine bioactivity in health and disease.
Diamond P, Doran P, Brady HR, McGinty A. Diamond P, et al. J Nephrol. 2000 Jan-Feb;13(1):9-14. J Nephrol. 2000. PMID: 10720209 Review. - Suppressors of cytokine signaling (SOCS): inhibitors of the JAK/STAT pathway.
Cooney RN. Cooney RN. Shock. 2002 Feb;17(2):83-90. doi: 10.1097/00024382-200202000-00001. Shock. 2002. PMID: 11837794 Review.
Cited by
- Suppressor of cytokine signaling (SOCS) genes are silenced by DNA hypermethylation and histone deacetylation and regulate response to radiotherapy in cervical cancer cells.
Kim MH, Kim MS, Kim W, Kang MA, Cacalano NA, Kang SB, Shin YJ, Jeong JH. Kim MH, et al. PLoS One. 2015 Apr 7;10(4):e0123133. doi: 10.1371/journal.pone.0123133. eCollection 2015. PLoS One. 2015. PMID: 25849377 Free PMC article. - STAT proteins in cancer: orchestration of metabolism.
Li YJ, Zhang C, Martincuks A, Herrmann A, Yu H. Li YJ, et al. Nat Rev Cancer. 2023 Mar;23(3):115-134. doi: 10.1038/s41568-022-00537-3. Epub 2023 Jan 3. Nat Rev Cancer. 2023. PMID: 36596870 Review. - SOCS regulation of the JAK/STAT signalling pathway.
Croker BA, Kiu H, Nicholson SE. Croker BA, et al. Semin Cell Dev Biol. 2008 Aug;19(4):414-22. doi: 10.1016/j.semcdb.2008.07.010. Epub 2008 Jul 30. Semin Cell Dev Biol. 2008. PMID: 18708154 Free PMC article. Review. - Prognostic value of ZFP36 and SOCS3 expressions in human prostate cancer.
Zhu JG, Yuan DB, Chen WH, Han ZD, Liang YX, Chen G, Fu X, Liang YK, Chen GX, Sun ZL, Liu ZZ, Chen JH, Jiang FN, Zhong WD. Zhu JG, et al. Clin Transl Oncol. 2016 Aug;18(8):782-91. doi: 10.1007/s12094-015-1432-6. Epub 2015 Nov 13. Clin Transl Oncol. 2016. PMID: 26563146 - SOCS3 genetic variants and promoter hypermethylation in patients with chronic hepatitis B.
Hoan NX, Van Tong H, Giang DP, Cuong BK, Toan NL, Wedemeyer H, Bock CT, Kremsner PG, Song LH, Velavan TP. Hoan NX, et al. Oncotarget. 2017 Mar 7;8(10):17127-17139. doi: 10.18632/oncotarget.15083. Oncotarget. 2017. PMID: 28179578 Free PMC article.
References
- Cooney, R. N. (2002) Shock 17, 83–90. - PubMed
- Masuhara, M., Sakamoto, H., Matsumoto, A., Suzuki, R., Yasukawa, H., Mitsui, K., Wakioka, T., Tanimura, S., Sasaki, A., Misawa, H., et al. (1997) Biochem. Biophys. Res. Commun. 239, 439–446. - PubMed
- O'Shea, J. J., Gadina, M. & Schreiber, R. D. (2002) Cell 109, Suppl., S121–S131. - PubMed
- Aaronson, D. S. & Horvath, C. M. (2002) Science 296, 1653–1655. - PubMed
Publication types
MeSH terms
Substances
LinkOut - more resources
Full Text Sources
Other Literature Sources
Medical
Miscellaneous


