Lesions of the orbitofrontal but not medial prefrontal cortex disrupt conditioned reinforcement in primates - PubMed (original) (raw)
Lesions of the orbitofrontal but not medial prefrontal cortex disrupt conditioned reinforcement in primates
Andrew Pears et al. J Neurosci. 2003.
Abstract
The ventromedial prefrontal cortex (PFC) is implicated in affective and motivated behaviors. Damage to this region, which includes the orbitofrontal cortex as well as ventral sectors of medial PFC, causes profound changes in emotional and social behavior, including impairments in certain aspects of decision making. One reinforcement mechanism that may well contribute to these behaviors is conditioned reinforcement, whereby previously neutral stimuli in the environment, by virtue of their association with primary rewards, take on reinforcing value and come to support instrumental action. Conditioned reinforcers are powerful determinants of behavior and can maintain responding over protracted periods of time in the absence of and potentially in conflict with primary reinforcers. It has already been shown that conditioned reinforcement is dependent on the amygdala, and because the amygdala projects to both the orbitofrontal cortex and the medial PFC, the present study determined whether conditioned reinforcement was also dependent on one or the other of these prefrontal regions. Comparison of the behavioral effects of selective excitotoxic lesions of the PFC in the common marmoset revealed that orbitofrontal but not medial PFC lesions disrupted two distinct measures of conditioned reinforcement: (1) acquisition of a new response and (2) sensitivity to conditioned stimulus omission on a second-order schedule. In contrast, the orbitofrontal lesion did not affect sensitivity to primary reinforcement as measured by responding on a progressive-ratio schedule and a home cage consumption test. Together, these findings demonstrate the critical and specific involvement of the orbitofrontal cortex but not the medial PFC in conditioned reinforcement.
Figures
Figure 1.
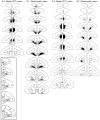
Schematic diagrams of a series of coronal sections through the frontal lobe of the marmoset illustrating the site of the lesion of the medial PFC and orbitofrontal lesion of group 1 (G.1) in experiments 1, 2, and 4 and group 2 (G.2) in experiments 3 and 4. The different levels of shading, ranging from solid black to pale gray, represent the areas of cortex that were damaged in all monkeys, in all monkeys but one, etc., to just one monkey, respectively. The distribution of granular (G), dysgranular (dG), and agranular (aG) regions of cortex within the frontal lobes of the marmoset are illustrated in the series of coronal sections depicted in the inset. The frontal pole is granular throughout. The shaded regions on each coronal section within the inset represent the regions on the orbital surface and the medial wall that were the targets for the orbitofrontal and medial PFC lesions, respectively.
Figure 2.
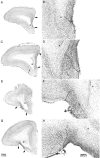
Low-power (A, C, E, G) and high-power (B, D, F, H) photomicrographs of cresyl fast violet-stained coronal sections through rostral (A, B, E, F) and intermediate (C, D, G, H) levels of the frontal lobe taken from a representative marmoset from the medial PFC (A-D)- and orbitofrontal (E-H)-lesioned groups. The extensive cell loss in the lesioned areas is in stark contrast to the dense layering of neurons seen in the adjacent intact areas. In addition, the loss of orbitofrontal tissue in the orbitofrontal-lesioned monkey (E, G) is in contrast to the intact orbitofrontal cortex in the medial PFC-lesioned monkey (A, C) and vice versa. The arrows in A, C, E, and G and the dotted lines in B, D, F, and H mark the border(s) of the lesion. The asterisks mark the same position in A, C, E, and G as they do in B, D, F, and H, respectively.
Figure 3.
A, Mean ± SEM number of responses at each level of the second-order schedule both before and after surgery for control animals (n = 5), animals with orbitofrontal lesions (n = 5), and animals with medial PFC lesions (n = 4). Numbers in parentheses indicate the numbers of animals remaining in each group at each level of the schedule. FR_x_(FR_y_:S) denotes y number of responses before presentation of the CS (S) and x number of CSs before receiving primary reinforcement. Thus, 5(7:S) reflects the level at which seven responses are required before presentation of a CS and five such CSs must be gained, and thus a total of 35 responses made, before obtaining primary reinforcement. B, The ratio of responses on the CS omission and post-CS omission phases relative to the pre-CS omission phase [e.g., CS omission/(CS omission + pre-CS omission)] for the control, orbitofrontal, and medial PFC-lesioned groups. A score of 0.5 indicates that responding was equivalent to the pre-CS omission phase. Each symbol represents the ratio score of an individual animal. The asterisk indicates that the response ratio for the CS omission phase in the orbitofrontal-lesioned group was significantly greater than that of the control group at p < 0.05.
Figure 4.
The cumulative mean ± SEM volume of liquid reward consumed in the home cage across three consecutive 20 min time bins represented by the open, light gray, and dark gray sectors of the histograms, respectively, in control (n = 5), orbitofrontal-lesioned (n = 5), and medial PFC-lesioned (n = 4) groups. Three different concentrations of reward were tested on different days: normal (i.e., the concentration used as reward in the test apparatus), weak (i.e., a concentration half as strong as normal), and strong (i.e., a concentration twice as strong as normal).
Figure 5.
A, Mean ± SEM number of responses at each level of the progressive-ratio schedule for the control (n = 4), orbitofrontal-lesioned (n = 3), and medial PFC-lesioned (n = 5) groups. Numbers on the _x_-axis reflect the total numbers of responses required at each level to receive primary reinforcement. Numbers in parentheses indicate the numbers of animals remaining in each group at each level of the schedule. B, The ratio of response rates on the US omission and post-US omission phases relative to the pre-US omission phase [e.g., US omission/(US omission + pre-US omission)] for the control, orbitofrontal, and medial PFC-lesioned groups. A score of 0.5 indicates that responding was equivalent to the pre-US omission phase. Each symbol represents the ratio score of an individual animal.
Figure 6.
Mean ± SEM number of responses to the visual stimulus paired with the CS+ and to the visual stimulus paired with the CS- across the two sessions of acquisition of a new response in control (n = 8), orbitofrontal-lesioned (n = 8), and medial PFC-lesioned (n = 7) groups. Although the control and medial PFC-lesioned groups responded more to the stimulus paired with the CS+ than to the stimulus paired with the CS-, the orbitofrontal-lesioned group did not. Double and single asterisks indicate that responding to the CS+ was significantly greater than responding to the CS- at p < 0.01 and p < 0.05, respectively.
Similar articles
- The role of the primate amygdala in conditioned reinforcement.
Parkinson JA, Crofts HS, McGuigan M, Tomic DL, Everitt BJ, Roberts AC. Parkinson JA, et al. J Neurosci. 2001 Oct 1;21(19):7770-80. doi: 10.1523/JNEUROSCI.21-19-07770.2001. J Neurosci. 2001. PMID: 11567067 Free PMC article. - The role of the orbitofrontal cortex in the pursuit of happiness and more specific rewards.
Burke KA, Franz TM, Miller DN, Schoenbaum G. Burke KA, et al. Nature. 2008 Jul 17;454(7202):340-4. doi: 10.1038/nature06993. Epub 2008 Jun 18. Nature. 2008. PMID: 18563088 Free PMC article. - Lesions of ventrolateral prefrontal or anterior orbitofrontal cortex in primates heighten negative emotion.
Agustín-Pavón C, Braesicke K, Shiba Y, Santangelo AM, Mikheenko Y, Cockroft G, Asma F, Clarke H, Man MS, Roberts AC. Agustín-Pavón C, et al. Biol Psychiatry. 2012 Aug 15;72(4):266-72. doi: 10.1016/j.biopsych.2012.03.007. Epub 2012 Apr 12. Biol Psychiatry. 2012. PMID: 22502990 - The functions of the orbitofrontal cortex.
Rolls ET. Rolls ET. Brain Cogn. 2004 Jun;55(1):11-29. doi: 10.1016/S0278-2626(03)00277-X. Brain Cogn. 2004. PMID: 15134840 Review. - The orbitofrontal cortex and emotion in health and disease, including depression.
Rolls ET. Rolls ET. Neuropsychologia. 2019 May;128:14-43. doi: 10.1016/j.neuropsychologia.2017.09.021. Epub 2017 Sep 24. Neuropsychologia. 2019. PMID: 28951164 Review.
Cited by
- Ethanol self-administration modulation of NMDA receptor subunit and related synaptic protein mRNA expression in prefrontal cortical fields in cynomolgus monkeys.
Acosta G, Hasenkamp W, Daunais JB, Friedman DP, Grant KA, Hemby SE. Acosta G, et al. Brain Res. 2010 Mar 8;1318:144-54. doi: 10.1016/j.brainres.2009.12.050. Epub 2010 Jan 4. Brain Res. 2010. PMID: 20043891 Free PMC article. - A neural systems analysis of the potentiation of feeding by conditioned stimuli.
Holland PC, Petrovich GD. Holland PC, et al. Physiol Behav. 2005 Dec 15;86(5):747-61. doi: 10.1016/j.physbeh.2005.08.062. Epub 2005 Oct 25. Physiol Behav. 2005. PMID: 16256152 Free PMC article. Review. - Involvement of the lateral orbitofrontal cortex in drug context-induced reinstatement of cocaine-seeking behavior in rats.
Lasseter HC, Ramirez DR, Xie X, Fuchs RA. Lasseter HC, et al. Eur J Neurosci. 2009 Oct;30(7):1370-81. doi: 10.1111/j.1460-9568.2009.06906.x. Epub 2009 Sep 21. Eur J Neurosci. 2009. PMID: 19769591 Free PMC article. - Conditioned reinforcement can be mediated by either outcome-specific or general affective representations.
Burke KA, Franz TM, Miller DN, Schoenbaum G. Burke KA, et al. Front Integr Neurosci. 2007 Nov 2;1:2. doi: 10.3389/neuro.07.002.2007. eCollection 2007. Front Integr Neurosci. 2007. PMID: 18958230 Free PMC article. - The mGluR5 antagonist MTEP dissociates the acquisition of predictive and incentive motivational properties of reward-paired stimuli in mice.
O'Connor EC, Crombag HS, Mead AN, Stephens DN. O'Connor EC, et al. Neuropsychopharmacology. 2010 Jul;35(8):1807-17. doi: 10.1038/npp.2010.48. Epub 2010 Apr 7. Neuropsychopharmacology. 2010. PMID: 20375996 Free PMC article.
References
- Amaral DG, Price JL, Pitakanen A, Carmichael ST ( 1992) Anatomical organization of the primate amygdaloid complex. In: The amygdala (Aggleton JP, ed), pp 1-66. New York: Wiley-Liss.
- Arroyo M, Markou A, Robbins TW, Everitt BJ ( 1998) Acquisition, maintenance and reinstatement of intravenous cocaine self-administration under a second-order schedule of reinforcement in rats: effects of conditioned cues and continuous access to cocaine. Psychopharmacology (Berl) 140: 331-344. - PubMed
- Balleine BW, Dickinson A ( 1998) Goal-directed instrumental action: contingency and incentive learning and their cortical substrates. Neuropharmacology 37: 407-419. - PubMed
Publication types
MeSH terms
Substances
LinkOut - more resources
Full Text Sources
Miscellaneous


