IkappaBalpha/IkappaBepsilon deficiency reveals that a critical NF-kappaB dosage is required for lymphocyte survival - PubMed (original) (raw)
IkappaBalpha/IkappaBepsilon deficiency reveals that a critical NF-kappaB dosage is required for lymphocyte survival
Bertrand Goudeau et al. Proc Natl Acad Sci U S A. 2003.
Abstract
In most cells, the NF-kappaB transcription factor is sequestered in the cytoplasm by interaction with inhibitory proteins, the IkappaBs. Here, we show that combined IkappaBalpha/IkappaBepsilon deficiency in mice leads to neonatal death, elevated kappaB binding activity, overexpression of NF-kappaB target genes, and disruption of lymphocyte production. In IkappaBalpha/IkappaBepsilon-deficient fetuses, B220+IgM+ B cells and single-positive T cells die by apoptosis. In adults, IkappaBalpha-/-IkappaBepsilon-/- reconstituted chimeras exhibit a nearly complete absence of T and B cells that is not rescued by cotransfer with wild-type bone marrow. These findings demonstrate that IkappaBs tightly control NF-kappaB activity in vivo and that increased NF-kappaB activity intrinsically impairs lymphocyte survival. Because reduction or rise of NF-kappaB activity leads to similar dysfunction, they also reveal that only a narrow window of NF-kappaB activity is tolerated by lymphocytes.
Figures
Fig. 1.
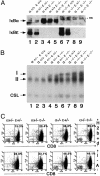
Constitutive up-regulation of NF-κB DNA binding activity and overexpression of NF-κB target genes in IκBα/IκBε-nullizygous mice. (A)IκBα/IκBε status in total thymic protein extracts (120 μg) from E18.5 fetuses analyzed by Western blot. Genotypes are indicated; ns, nonspecific band. (B) Nuclear extracts (0.5 μg) from thymus of E18.5 fetuses analyzed by electrophoretic mobility-shift assay for binding to a canonical κB site. Arrows indicate the complexes visualized: I and II for the different Rel/NF-κB dimers; CSL was used as an internal control. (C) Expression of H-2Kb+d and I-A antigens on CD8+ thymocytes was assayed by two-color flow cytometry. An identical number of CD8+ cells was found in all genotypes. Percentages of positive events in the corresponding quadrant thus reflect the levels of expression of MHC antigens.
Fig. 2.
Impaired B cell development in IκBα/IκBε-nullizygous fetuses. Single-cell suspensions from thymus (A), liver (B), and spleen (C) of E18.5 fetuses genotyped as indicated were stained for CD4, CD8, IgM, B220, CD43, GR1, or Mac1 and then analyzed by flow cytometry. Gates are shown by boxes, and percentages of gated cells within the plot are specified above or inside the quadrant. For single-color staining, percentages of positive events are indicated in each graph. (D) Analysis of Ig heavy (D-JH) and light (V-Jκ) chain rearrangement status in E18.5 FL lymphocytes genotyped as indicated. No DNA corresponds to the analysis done in the absence of DNA as a negative control. TCR gene amplification was done in parallel on the same DNA preparations as an internal control.
Fig. 3.
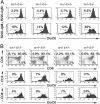
In IκBα/IκBε-nullizygous fetuses, programmed cell death is a feature of immature B cells and SP thymocytes. (A) Spleen lymphocytes from E18.5 fetuses genotyped as indicated were stained for B220 and IgM, assayed for apoptosis by DioC6 staining, and analyzed by flow cytometry. Percentages of apoptotic cells within the B220+IgM- and B220+IgM+ populations are indicated in the histograms. Results are representative of at least six separate experiments. (B) Thymocytes from 2.5-day FTOC of E18.5 thymi were stained for CD4 and CD8 and analyzed by flow cytometry (Top). Gates are shown by boxes, and percentages of gated cells within the plot are specified above or inside the boxes. Cells gated as SP CD4+ (Middle) or CD8+ (Bottom) were further assayed for apoptosis by DioC6 staining. Percentages indicate the apoptotic cells. Results are representative of at least four separate experiments.
Fig. 4.
Impaired B cell survival of IκBα/IκBε-nullizygous FL cultures in vitro. Flow cytometry analysis of E15.5 FL cells cultured for 7 days and stained for B220 and IgM. Gates are shown by boxes, and percentages of gated cells of total cells within the plot are specified at the right of the quadrant. Data shown are examples of three independent experiments.
Fig. 5.
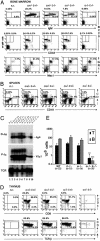
Extended lymphopenia in IκBα/IκBε-nullizygous chimeras. Single-cell suspensions from bone marrow (A), spleen (B), and thymus (D) isolated from RAG2/γc mice nonreconstituted (n.r.) or reconstituted with FL cells genotyped as indicated were stained for IgM, B220, CD43, GR1, Mac1, CD3, CD19, CD4, CD8, or TCRβ and analyzed by flow cytometry. Gates are shown by boxes, and percentages of gated cells within the plot are specified above or inside the quadrant. (C) Analysis of Ig heavy (D-JH) and light (V-Jκ) chain rearrangement status in nonreconstituted (n.r., lane 1), wild-type (lanes 2 and 3), IκBε (lanes 4 and 5), IκBα (lanes 6 and 7), and IκBα/IκBε-nullizygous (lanes 8-10) chimeric splenocytes. TCR gene amplification was done in parallel on the same DNA preparations as an internal control. Note the absence of Ig heavy and light chain gene rearrangement in the nonreconstituted host despite normal TCR gene amplification. (E) T and B cell absolute numbers in the spleen of RAG2/γc chimeras.*, P < 0.00023; **, P < 4 × 10⁻⁷; ***, P < 4 × 10-17.
Fig. 6.
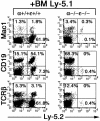
T and B lymphopoiesis defect of IκBα/IκBε-nullizygous RAG2/γc reconstituted chimeras is cell intrinsic. Immunostaining of splenocytes from FL wild-type- or IκBα/IκBε-nullizygous- and Ly-5.1-coinjected mice. Cells were stained for specific markers of donor (Ly-5.2) macrophages (Mac1), B lymphocytes (CD19), and T lymphocytes (TCRβ) and analyzed by fluorescence-activated cell sorting. The percentage of gated cells of total cells within the plot are specified inside the corresponding quadrant. Genotypes above plots refer to that of donor Ly-5.2 FL cells.
Similar articles
- Combined deficiency in IkappaBalpha and IkappaBepsilon reveals a critical window of NF-kappaB activity in natural killer cell differentiation.
Samson SI, Mémet S, Vosshenrich CA, Colucci F, Richard O, Ndiaye D, Israël A, Di Santo JP. Samson SI, et al. Blood. 2004 Jun 15;103(12):4573-80. doi: 10.1182/blood-2003-08-2975. Epub 2004 Feb 5. Blood. 2004. PMID: 14764534 - Reductions in I kappa B epsilon and changes in NF-kappa B activity during B lymphocyte differentiation.
Doerre S, Mesires KP, Daley KM, McCarty T, Knoetig S, Corley RB. Doerre S, et al. J Immunol. 2005 Jan 15;174(2):983-91. doi: 10.4049/jimmunol.174.2.983. J Immunol. 2005. PMID: 15634922 - Characterization of the nuclear import and export functions of Ikappa B(epsilon).
Lee SH, Hannink M. Lee SH, et al. J Biol Chem. 2002 Jun 28;277(26):23358-66. doi: 10.1074/jbc.M111559200. Epub 2002 Apr 22. J Biol Chem. 2002. PMID: 11970947 - Cloning and functional characterization of mouse IkappaBepsilon.
Simeonidis S, Liang S, Chen G, Thanos D. Simeonidis S, et al. Proc Natl Acad Sci U S A. 1997 Dec 23;94(26):14372-7. doi: 10.1073/pnas.94.26.14372. Proc Natl Acad Sci U S A. 1997. PMID: 9405619 Free PMC article. - Pathophysiology of limb girdle muscular dystrophy type 2A: hypothesis and new insights into the IkappaBalpha/NF-kappaB survival pathway in skeletal muscle.
Baghdiguian S, Richard I, Martin M, Coopman P, Beckmann JS, Mangeat P, Lefranc G. Baghdiguian S, et al. J Mol Med (Berl). 2001 Jun;79(5-6):254-61. doi: 10.1007/s001090100225. J Mol Med (Berl). 2001. PMID: 11485017 Review.
Cited by
- NF-κB, the first quarter-century: remarkable progress and outstanding questions.
Hayden MS, Ghosh S. Hayden MS, et al. Genes Dev. 2012 Feb 1;26(3):203-34. doi: 10.1101/gad.183434.111. Genes Dev. 2012. PMID: 22302935 Free PMC article. Review. - NF-kappaB regulates spatial memory formation and synaptic plasticity through protein kinase A/CREB signaling.
Kaltschmidt B, Ndiaye D, Korte M, Pothion S, Arbibe L, Prüllage M, Pfeiffer J, Lindecke A, Staiger V, Israël A, Kaltschmidt C, Mémet S. Kaltschmidt B, et al. Mol Cell Biol. 2006 Apr;26(8):2936-46. doi: 10.1128/MCB.26.8.2936-2946.2006. Mol Cell Biol. 2006. PMID: 16581769 Free PMC article. - B-cell survival and development controlled by the coordination of NF-κB family members RelB and cRel.
Almaden JV, Liu YC, Yang E, Otero DC, Birnbaum H, Davis-Turak J, Asagiri M, David M, Goldrath AW, Hoffmann A. Almaden JV, et al. Blood. 2016 Mar 10;127(10):1276-86. doi: 10.1182/blood-2014-10-606988. Epub 2016 Jan 14. Blood. 2016. PMID: 26773039 Free PMC article. - Immune responses in neonates.
Basha S, Surendran N, Pichichero M. Basha S, et al. Expert Rev Clin Immunol. 2014 Sep;10(9):1171-84. doi: 10.1586/1744666X.2014.942288. Epub 2014 Aug 4. Expert Rev Clin Immunol. 2014. PMID: 25088080 Free PMC article. Review. - Chronic activation of the kinase IKKβ impairs T cell function and survival.
Krishna S, Xie D, Gorentla B, Shin J, Gao J, Zhong XP. Krishna S, et al. J Immunol. 2012 Aug 1;189(3):1209-19. doi: 10.4049/jimmunol.1102429. Epub 2012 Jun 29. J Immunol. 2012. PMID: 22753932 Free PMC article.
References
- Gerondakis, S., Grumont, R., Rourke, I. & Grossmann, M. (1998) Curr. Opin. Immunol. 10, 353-359. - PubMed
- Karin, M. & Lin, A. (2002) Nat. Immunol. 3, 221-227. - PubMed
- Li, Q. & Verma, I. M. (2002) Nat. Rev. Immunol. 2, 725-734. - PubMed
- Whiteside, S. T. & Israel, A. (1997) Semin. Cancer Biol. 8, 75-82. - PubMed
- Beg, A. A., Sha, W. C., Bronson, R. T. & Baltimore, D. (1995) Genes Dev. 9, 2736-2746. - PubMed
Publication types
MeSH terms
Substances
LinkOut - more resources
Full Text Sources
Molecular Biology Databases
Research Materials


