Dissection of Arabidopsis Bax inhibitor-1 suppressing Bax-, hydrogen peroxide-, and salicylic acid-induced cell death - PubMed (original) (raw)
Dissection of Arabidopsis Bax inhibitor-1 suppressing Bax-, hydrogen peroxide-, and salicylic acid-induced cell death
Maki Kawai-Yamada et al. Plant Cell. 2004 Jan.
Abstract
Overexpression of plant Bax Inhibitor-1 (BI-1) was able to suppress Bax-mediated cell death in yeast and Arabidopsis. Here, we demonstrate that reactive oxygen species production induced by the ectopic expression of Bax was insensitive to the coexpression of AtBI-1. Similarly, H2O2- or salicylic acid-mediated cell death also was suppressed in tobacco BY-2 cells overexpressing AtBI-1. To define the functional domain of AtBI-1 as a cell death suppressor, a truncated series of the AtBI-1 protein was analyzed in yeast possessing a galactose-inducible mammalian Bax. The results showed that DeltaC-AtBI-1 (with the C-terminal 14 amino acids deleted) lost the ability to sustain cell growth. Furthermore, a mutant protein in which the C-terminal seven amino acid residues of AtBI-1 were replaced with others lacking a coiled-coil structure failed to inhibit cell death, suggesting that the C-terminal region is essential for the inhibition of cell death. We also noted that the C-terminal hydrophilic region was interchangeable between animal and plant Bax inhibitors.
Figures
Figure 1.
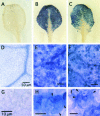
Cytological Observation of ROS Production in Plants Expressing Bax. To detect superoxide radical (O2−), 3-week-old transgenic Arabidopsis plants treated with DEX were stained with NBT. Each plant was treated with 5 μM DEX for 7 h to induce Bax. Detached leaves of non-DEX-treated ([A], [D], and [G]) or DEX-treated transgenic plants possessing Bax ([B], [E], and [H]) or DEX-treated Bax+AtBI-GFP plants ([C], [F], and [I]) were infiltrated with NBT solution. After the stained leaves were boiled in acetic acid:glycerol:ethanol to remove the chlorophyll, evidence of ROS production was observed with a light microscope. (D) to (I) show magnified images of (A) to (C). Formazan precipitates are indicated with arrowheads in (H) and (I). The presence of the formazan precipitate indicates the location of O2−. The experiment was repeated at least three times, and representative photographs are presented.
Figure 2.
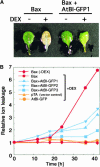
Suppression of Ion Leakage from Detached Leaves of Transgenic Arabidopsis Expressing Both Bax and AtBI-1. (A) Three-week-old Bax and Bax+AtBI-GFP1 transgenic plants were used in the experiments. Detached leaves were incubated with (+) or without (−) 5 μM DEX in distilled water at 23°C for 4 days, and photographs were taken. (B) Detached leaves from transgenic plants containing pTA7002 (vector control; pTA), pTA-Bax (Bax), Bin-AtBI-GFP (AtBI-GFP), or both pTA-Bax and Bin-AtBI-GFP (Bax+AtBI-GFP1 to Bax+AtBI-GFP3) were incubated with 5 μM DEX in distilled water at 23°C. Bax+AtBI-GFP1 to Bax+AtBI-GFP3 are independent lines. The electrical conductivity of the solution was measured with a conductivity meter and is indicated as a relative value. n = 5.
Figure 3.
Inhibition of H2O2-Induced Cell Death by AtBI-1. (A) Induction of cell death by exogenously supplied H2O2 in tobacco BY-2 suspension cells. Evans blue treatment was performed at 0, 2, 6, 10, and 20 h after the addition of 3 mM H2O2, and dead cells showing shrunken blue cytoplasm were scored with a light microscope. Data shown are means ± SE of three experiments. (B) Comparison of AtBI-1 (AtBI-GFP2) and control (GFP1) cells stained with Evans blue at 18 h after treatment with 3 mM H2O2. (C) Effects of AtBI-1 or ΔC-AtBI-1 on H2O2-induced cell death. Tobacco BY-2 cells expressing GFP, AtBI-GFP, or ΔC-AtBI-GFP were incubated with H2O2 (0 to 4 mM) for 18 h. Dead cells were scored, and the results are expressed as means ±
sd
of at least three experiments. WT, wild type. (D) Turnover of H2O2 after its addition to transgenic cell lines expressing GFP, AtBI-GFP, or ΔC-AtBI-GFP. One millimolar H2O2 was added to each cell line, and the H2O2 concentration of the medium was measured after 5 min. Data shown are means ± SE of three experiments. gfw, grams fresh weight.
Figure 4.
Inhibition of SA-Induced Cell Death by AtBI-1. Tobacco BY-2 cells expressing GFP, AtBI-GFP, or ΔC-AtBI-GFP were treated with 500 μM (A) or 750 μM (B) SA and then cultured for 18 h before examination with Evans blue staining. Dead cells stained with Evans blue were scored, and values are expressed as percentages. Data shown are means ± SE of more than three replications. (C) shows microscopic images of cells at 18 h after 750 μM SA treatment. WT, wild type.
Figure 5.
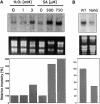
Accumulation of AtBI-1 mRNA in Arabidopsis Cells under Oxidative Stress or in NahG Transgenic Plants. (A) Arabidopsis suspension cells (3 days old) were treated with H2O2 (1 and 3 mM) or SA (500 and 750 μM) for 24 h under continuous shaking. Equal amounts of total RNAs (10 μg) were electrophoresed on a 1.2% formaldehyde agarose gel and transferred to a membrane. An α-32P-dCTP–labeled 3′ untranslated region of AtBI-1 cDNA was used as a probe. (B) Analysis of AtBI-1 mRNA accumulation in NahG transgenic plants. Total RNAs (20 μg) from 2-week-old wild-type (WT) and NahG transgenic plants were electrophoresed and hybridized. The middle panels in (A) and (B) show gels stained with ethidium bromide for rRNA. The bottom panels show relative levels of AtBI-1 expression in Arabidopsis suspension cells treated with H2O2 and SA (A) and NahG transgenic plants (B). Quantitative measurements of RNA gel blots were performed using the BAS1500 imaging plate scanner.
Figure 6.
Evaluation of Cell Death Inhibition Activity in a Truncated Series of AtBI-1 Proteins to Bax. (A) Schemes of truncated AtBI-1 proteins. ΔN-, ΔC-, and ΔNC-AtBI-1 were constructed using PCR as described in Methods. The red bar shown in the C-terminal region of AtBI-1 indicates the conserved domain exhibited in (C). The results of cell death suppression from (B) are shown at right. ++, suppressed; + weakly suppressed; −, not suppressed. TM1 to TM7, transmembrane domains 1 to 7. (B) The full-length AtBI-1 (AtBI), constructed AtBI-1 mutants (ΔN, ΔC, and ΔNC), and the empty vector pYX112 (pYX) were transformed to a yeast strain possessing galactose-inducible mammalian Bax and streaked on glucose (Glu)- or galactose (Gal)-containing medium. The photograph was taken after 3 days of incubation at 30°C. (C) Amino acid comparisons of the C-terminal region of BI-1 proteins from various organisms. AtBI-1, Arabidopsis thaliana (Kawai et al., 1999); OsBI-1, Oryza sativa (Kawai et al., 1999); BnBI-1, Brassica napus; NtBI-1, Nicotiana tabacum; HvBI-1, Hordeum vulgare; HsBI-1, Homo sapiens; RnBI-1, Rattus norvegicus; MmBI-1, Mus musculus; PoBI-1, Paralichthys olivaceus. Red letters (K and R) indicate positively charged amino acids. Blue letters (D and E) indicate negatively charged amino acids. (D) The probability of forming the coiled-coil structure calculated using the COILs program (available at
http://www.ch.embnet.org/software/COILS\_form.html
). A putative coiled-coil region is predicted in the C-terminal region of the AtBI-1 protein. aa, amino acids.
Figure 7.
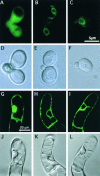
Localization of a C-Terminal Truncated AtBI-GFP (ΔC-AtBI-GFP) Protein in Yeast and Plant Cells. Distribution of GFP ([A], [D], [G], and [J]), AtBI-GFP ([B], [E], [H], and [K]), and ΔC-AtBI-GFP ([C], [F], [I], and [L]) in yeast ([A] to [F]) or tobacco BY-2 ([G] to [L]) was observed with a fluorescence microscope (DMRD; Leica) ([A] to [F]) or a confocal laser scanning microscope (BX50; Olympus) ([G] to [L]). Fluorescence ([A] to [C] and [G] to [I]) and bright-field ([D] to [F] and [J] to [L]) images are displayed.
Figure 8.
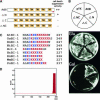
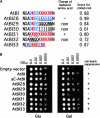
Comparison of the Cell Death–Suppression Activity of C-Terminal Mutants of AtBI-1. (A) Various mutations of the C terminus of AtBI-1 were constructed, and their ability to suppress Bax-induced cell death was analyzed. Mutated series of AtBI-1 (AtBI28 to AtBI33) were constructed using PCR as described in Methods. The amino acids replaced are underlined. The estimated charges (+, −, or none) of the replaced regions and calculated scores for the coiled-coil structure also are indicated. In AtBI33, the C-terminal 14 amino acids were replaced with the 9 amino acids of human BI-1. (B) Spot assay of cell death–suppression activity in yeast. Yeast transformed with plasmids containing mutagenized AtBI-1 genes were cultured in SD medium containing glucose. After 1 day of shaking, the OD600 of each culture was adjusted to 0.2 and diluted to 0.0002. Each dilution was spotted on SD medium containing glucose (Glu) or galactose (Gal). The results show the growth of each line after 2 days (Glu) and 4 days (Gal) of incubation at 30°C. The results of cell death suppression are shown at right: +, suppressed; −, weak suppression or not suppressed.
Figure 9.
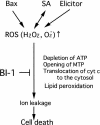
Scheme of the Role of the BI-1 Protein in the ROS-Induced Cell Death Pathway. ROS cause mitochondrial permeability transition, ATP depletion, release of cytochrome c from the mitochondrial membranes, and lipid peroxidation, which cause ion leakage and cell death (Rao and Davis, 1999; Houot et al., 2001; Maxwell et al., 2002; Tiwari et al., 2002). BI-1 proteins, as components of the ER membrane, are involved in counteracting “oxidative stress.”
Similar articles
- Mammalian Bax-induced plant cell death can be down-regulated by overexpression of Arabidopsis Bax Inhibitor-1 (AtBI-1).
Kawai-Yamada M, Jin L, Yoshinaga K, Hirata A, Uchimiya H. Kawai-Yamada M, et al. Proc Natl Acad Sci U S A. 2001 Oct 9;98(21):12295-300. doi: 10.1073/pnas.211423998. Epub 2001 Oct 2. Proc Natl Acad Sci U S A. 2001. PMID: 11593047 Free PMC article. - AtBI-1, a plant homologue of Bax inhibitor-1, suppresses Bax-induced cell death in yeast and is rapidly upregulated during wounding and pathogen challenge.
Sanchez P, de Torres Zabala M, Grant M. Sanchez P, et al. Plant J. 2000 Feb;21(4):393-9. doi: 10.1046/j.1365-313x.2000.00690.x. Plant J. 2000. PMID: 10758491 - Cell death suppressor Arabidopsis bax inhibitor-1 is associated with calmodulin binding and ion homeostasis.
Ihara-Ohori Y, Nagano M, Muto S, Uchimiya H, Kawai-Yamada M. Ihara-Ohori Y, et al. Plant Physiol. 2007 Feb;143(2):650-60. doi: 10.1104/pp.106.090878. Epub 2006 Dec 1. Plant Physiol. 2007. PMID: 17142482 Free PMC article. - BAX Inhibitor-1, an ancient cell death suppressor in animals and plants with prokaryotic relatives.
Hückelhoven R. Hückelhoven R. Apoptosis. 2004 May;9(3):299-307. doi: 10.1023/b:appt.0000025806.71000.1c. Apoptosis. 2004. PMID: 15258461 Review. - Bcl-2 gene family and the regulation of programmed cell death.
Yin XM, Oltvai ZN, Veis-Novack DJ, Linette GP, Korsmeyer SJ. Yin XM, et al. Cold Spring Harb Symp Quant Biol. 1994;59:387-93. doi: 10.1101/sqb.1994.059.01.043. Cold Spring Harb Symp Quant Biol. 1994. PMID: 7587091 Review. No abstract available.
Cited by
- Melatonin Protects Tobacco Suspension Cells against Pb-Induced Mitochondrial Dysfunction.
Kobylińska A, Posmyk MM. Kobylińska A, et al. Int J Mol Sci. 2021 Dec 13;22(24):13368. doi: 10.3390/ijms222413368. Int J Mol Sci. 2021. PMID: 34948164 Free PMC article. - Bax inhibitor-1: a highly conserved endoplasmic reticulum-resident cell death suppressor.
Ishikawa T, Watanabe N, Nagano M, Kawai-Yamada M, Lam E. Ishikawa T, et al. Cell Death Differ. 2011 Aug;18(8):1271-8. doi: 10.1038/cdd.2011.59. Epub 2011 May 20. Cell Death Differ. 2011. PMID: 21597463 Free PMC article. Review. - The characteristics of Bax inhibitor-1 and its related diseases.
Li B, Yadav RK, Jeong GS, Kim HR, Chae HJ. Li B, et al. Curr Mol Med. 2014;14(5):603-15. doi: 10.2174/1566524014666140603101113. Curr Mol Med. 2014. PMID: 24894176 Free PMC article. Review. - Arabidopsis Bax Inhibitor-1 inhibits cell death induced by pokeweed antiviral protein in Saccharomyces cerevisiae.
Çakır B, Tumer NE. Çakır B, et al. Microb Cell. 2015 Feb 2;2(2):43-56. doi: 10.15698/mic2015.02.190. Microb Cell. 2015. PMID: 28357275 Free PMC article.
References
- An, G., Ebert, R.R., Mitra, A., and Ha, S.B. (1998). Binary vectors. In Plant Molecular Biology Manual, S.B. Gelvin and R.A. Schilperoort, eds (Dordrecht, The Netherlands: Kluwer Academic Publishers), pp. 1–19.
- Bolduc, N., and Brisson, L.F. (2003). Antisense down regulation of NtBI-1 in tobacco BY-2 cells induces accelerated cell death upon carbon starvation. FEBS Lett. 532, 111–114. - PubMed
Publication types
MeSH terms
Substances
LinkOut - more resources
Full Text Sources
Other Literature Sources
Research Materials
