mTOR controls cell cycle progression through its cell growth effectors S6K1 and 4E-BP1/eukaryotic translation initiation factor 4E - PubMed (original) (raw)
mTOR controls cell cycle progression through its cell growth effectors S6K1 and 4E-BP1/eukaryotic translation initiation factor 4E
Diane C Fingar et al. Mol Cell Biol. 2004 Jan.
Abstract
The mammalian target of rapamycin (mTOR) integrates nutrient and mitogen signals to regulate cell growth (increased cell mass and cell size) and cell division. The immunosuppressive drug rapamycin inhibits cell cycle progression via inhibition of mTOR; however, the signaling pathways by which mTOR regulates cell cycle progression have remained poorly defined. Here we demonstrate that restoration of mTOR signaling (by using a rapamycin-resistant mutant of mTOR) rescues rapamycin-inhibited G(1)-phase progression, and restoration of signaling along the mTOR-dependent S6K1 or 4E-BP1/eukaryotic translation initiation factor 4E (eIF4E) pathways provides partial rescue. Furthermore, interfering RNA-mediated reduction of S6K1 expression or overexpression of mTOR-insensitive 4E-BP1 isoforms that block eIF4E activity inhibit G(1)-phase progression individually and additively. Thus, the activities of both the S6K1 and 4E-BP1/eIF4E pathways are required for and independently mediate mTOR-dependent G(1)-phase progression. In addition, overexpression of constitutively active mutants of S6K1 or wild-type eIF4E accelerates serum-stimulated G(1)-phase progression, and stable expression of wild-type S6K1 confers a proliferative advantage in low-serum-containing media, suggesting that the activity of each of these pathways is limiting for cell proliferation. These data demonstrate that, as for the regulation of cell growth and cell size, the S6K1 and 4E-BP1/eIF4E pathways each represent critical mediators of mTOR-dependent cell cycle control.
Figures
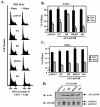
FIG. 1.
Rapamycin delays G1-phase progression in U2OS cells. U2OS cells were serum deprived for 30 h and then refed with DMEM-10% FBS for the indicated time points between 12 and 24 h in the absence (−Rapa) or presence (+Rapa) of rapamycin at 20 ng/ml. DNA content was determined on a flow cytometer. DNA content histograms are shown in panel A with the percentage of cells in each cell cycle phase indicated. Propidium iodide positive staining is graphed on the x axis with cell number on the y axis. Quantitation of the percentage of cells that have entered S phase at the various time points is shown graphically in panel B.
FIG. 2.
RR-mTOR rescues rapamycin-inhibited G1-phase progression. U2OS cells were transiently cotransfected with CD20 (1 μg) and various mTOR plasmids or pcDNA3 vector control (10 μg). After overnight incubation, cells were serum deprived, as described above, refed with DMEM-10% FBS for 20 h in the absence or presence of rapamycin, and analyzed on a flow cytometer. DNA content histograms of the FITC+ cells are shown in panel A. The percentage of FITC+ (B) and FITC− (C) cells that have entered S phase after 20 h serum stimulation is shown. (D) Protein expression levels of transfected mTOR constructs in this experiment were assayed by anti-AU1 immunoblotting. An anti-MAPK immunoblot is shown to control for protein loading. (E) In order to show that RR-mTOR rescues rapamycin-inhibited S6K1 signaling, cells were cotransfected with a panel of AU1-tagged mTOR constructs (10 μg) and HA-tagged S6K1 (1 μg). Cells were serum deprived, refed with DMEM-10% FBS in the absence or presence of rapamycin, lysed, and analyzed by anti-AU1, anti-HA, anti-MAPK, and anti-phospho-S6 immunoblotting. The activity of cotransfected S6K1 was assayed by anti-HA immune complex kinase assay using recombinant GST-S6 as in vitro substrate. (F) In order to show that RR-mTOR rescues rapamycin-inhibited 4E-BP1 phosphorylation, cells were cotransfected with a panel of AU1-tagged mTOR constructs (10 μg) and HA-tagged 4E-BP1 (1 μg). Cells were then serum deprived, refed with DMEM-10% FBS in the absence or presence of rapamycin, lysed, and analyzed by anti-AU1, anti-HA, and anti-MAPK immunoblotting. Short and long anti-HA immunoblot exposures are shown as indicated. The most hypophosphorylated 4E-BP1 species is marked α, the most hyperphosphorylated species is marked γ, and the band representing an intermediate phosphorylation state is marked β.
FIG. 3.
RR-S6K1 partially rescues rapamycin-inhibited G1-phase progression and accelerates G1-phase progression in the absence of drug. (A) U2OS cells were transiently cotransfected with CD20 (1 μg) and various HA-tagged S6K1 plasmids or pRK7 vector control (10 μg). Cells were then serum deprived, refed with DMEM-10% FBS for 20 h in the absence or presence of rapamycin, and analyzed on a flow cytometer. The percentage of FITC+ (transfected) cells that have entered S phase after 20 h serum stimulation is shown. P values to determine statistical significance for various comparisons are shown in the table to the right. When FITC− (untransfected) cells were analyzed (data not shown), there were no statistically significant differences. (B) The percentage of cells in G1 and S phase after 30 h serum deprivation is shown. (C) To determine the rapamycin-resistant activity displayed by two different RR-S6K1 constructs, cells were transiently transfected with a panel of HA-tagged S6K1 constructs (5 μg), serum deprived, and refed with media containing10% FBS in the absence or presence of rapamycin. Lysates were immunoblotted with anti-HA and anti-phospho-S6 antibodies. Kinase activity was determined by anti-HA immune complex kinase assay. (D) The kinase activity of transfected HA-S6K1-transfected cells after 30 h serum deprivation was determined by immune complex kinase assay as described above. Lysates were also immunoblotted with anti-HA, anti-MAPK (loading control), and anti-phospho-S6 antibodies.
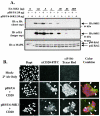
FIG. 4.
Reduction of S6K1 expression with plasmid-based RNAi inhibits G1-phase progression. (A) Cells were cotransfected with 10 μg of either pBS/U6 (RNAi vector) or pBS/U6-S6K1 (which expresses hairpin RNA that targets S6K1), together with various amounts of HA-tagged S6K1. After overnight transfection, cells were serum deprived, refed with DMEM-10% FBS for 20 h, and lysed. Lysates were immunoblotted with anti-HA and anti-MAPK (loading control) antibodies. Short and long anti-HA immunoblot exposures are shown as indicated. (B) Cells were cotransfected on coverslips with either CD20 (0.2 μg) and 2 μg of pBS/U6 (RNAi vector) or pBS/U6-S6K1 (S6K1-RNAi), serum deprived, refed with DMEM-10% FBS for 20 h, and processed for indirect immunofluorescence with anti-CD20 antibodies conjugated to FITC (green), anti-phospho-S6 antibodies, followed by anti-rabbit Texas red secondary antibodies (red), and DAPI to stain the nucleus (blue). Cells cotransfected with CD20 (FITC+) and either pBS/U6 (three cells) or pBS/US-S6K1 (four cells) are marked with open arrowheads. (C) Cells were cotransfected with CD20 (1 μg) and either pBS/U6 (−) or pBS/U6-S6K1 (+) (10 μg), serum deprived, refed where indicated with DMEM-10% FBS for 20 h in the absence or presence of rapamycin, and analyzed on a flow cytometer. The percentages of FITC+ cells in S phase after serum deprivation (−FBS) and of cells that have entered S phase after 20 h of stimulation (+FBS) are shown.
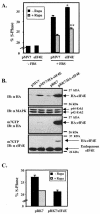
FIG. 5.
Overexpression of eIF4E partially rescues rapamycin-inhibited G1-phase progression and accelerates G1-phase progression in the absence of drug. (A) Cells were cotransfected with CD20 (1 μg) and either pMV7 vector or HA-eIF4E (expressed from pMV7) (10 μg), serum deprived, and then refed with DMEM/10% FBS in the absence or presence of rapamycin for 20 h. The percentages of FITC+ cells that were in S phase after serum deprivation (−FBS) and of those that entered S phase after 20 h stimulation (+FBS) are shown. ✽, P = 0.01 (comparison of pMV7 to eIF4E in the presence of FBS but without rapamycin); ✽✽, P = 0.004 (comparison of pMV7 to eIF4E in the presence of both FBS and rapamycin). (B) Vector pRK7 drives expression of eIF4E to much higher levels than vector pMV7. After transfection with vector controls, pMV7/HA-eIF4E, or pRK7/HA-eIF4E plasmids, cells were serum deprived, refed with DMEM-10% FBS for 20 h, and lysed. Protein expression levels were assayed by anti-HA and anti-MAPK (loading control) immunoblotting. Expression of transfected eIF4E (anti-HA blot) and endogenous eIF4E (anti-eIF4E blot) was also determined by m7GTP Sepharose affinity purification (m7GTP pull-down) as described in Materials and Methods. (C) Cells were cotransfected with CD20 (1 μg) and either pRK7 vector or eIF4E (expressed from pRK7) (10 μg), serum deprived, and then refed with DMEM-10% FBS in the absence or presence of rapamycin for 20 h. The percentage of cells in S phase after 20 h stimulation is shown.
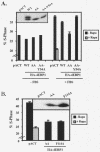
FIG. 6.
mTOR-insensitive mutants of 4E-BP1 inhibit G1-phase progression. Simultaneous downregulation of both the S6K1 and eIF4E pathways additively inhibit G1-phase progression. (A) Cells were transiently cotransfected with CD20 (1 μg) and various HA-tagged 4E-BP1 plasmids or pACTAG-2 vector control (10 μg). Cells were then serum deprived, refed with DMEM-10% FBS where indicated for 20 h in the absence or presence of rapamycin, and analyzed on a flow cytometer. The percentages of FITC+ cells in S phase after serum deprivation (−FBS) and of cells that have entered S phase after serum stimulation (+FBS) are shown. (B) Same as described in panel A, except cells were cotransfected with pACTAG2 vector control, the phosphorylation site mutant of 4E-BP1 (AA-4E-BP1), or the TOS-motif mutant (F114A-4E-BP1). The percentage of FITC+ cells in S phase after serum stimulation is shown. (C) The phosphorylation site mutant AA-4E-BP1 dominantly binds to eIF4E. Cells were transfected with various HA-tagged 4E-BP1 plasmids (+) or pACTAG-2 vector control (−) (5 μg), serum deprived, refed with DMEM-10% FBS where indicated for 20 h, and lysed. Protein expression levels in the lysate are shown by anti-HA and anti-MAPK (loading control) immunoblotting. m7GTP Sepharose affinity purifications (m7GTP pull-downs) were analyzed by immunoblotting with a combination of anti-HA and anti-eIF4E antibodies. (D) The phosphorylation site mutant AA-4E-BP1 dominantly inhibits cap-dependent translation. Cells were cotransfected with a bicistronic plasmid (pGFP/CAT) that directs expression of GFP in a cap-dependent manner (using the β-globin 5′-UTR) and CAT in an IRES-dependent manner (using the encephalomyocarditis virus IRES) (0.5 μg), together with HA-tagged 4E-BP1 plasmids or pACTAG-2 vector control (5 μg). Cells were serum deprived (−FBS), refed with DMEM-10% FBS (+FBS) in the absence or presence of rapamycin, and labeled with [35S]methionine-cysteine. Protein expression in the lysates was assayed by anti-HA and anti-MAPK (loading control) immunoblotting, and the expression of 35S-labeled GFP and CAT proteins was assayed by immunoprecipitation and SDS-PAGE (see Materials and Methods). The expression of GFP and CAT was quantitated on a phosphorimager and plotted as the ratio of the GFP signal versus the CAT signal (graph at bottom of panel). (E) Cells were transiently cotransfected with CD20 (1 μg), together with AA-4E-BP1 (5 μg) and pBS/U6-S6K1 (5 μg). Cells were then serum deprived, refed with DMEM-10% FBS where indicated for 20 h in the absence or presence of rapamycin, and analyzed on a flow cytometer. The percentages of FITC+ cells that were in S phase after serum deprivation (−FBS) and of cells that have entered S phase after serum stimulation (+FBS) are shown.
FIG. 7.
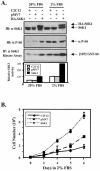
Overexpression of S6K1 in C2C12 myoblasts confers a proliferative advantage in low-serum-containing media. (A) Parental C2C12 myoblasts or C2C12 cells stably expressing HA-tagged S6K1 or pMV7 vector control as pools were cultured in DMEM containing either 20% (normal serum concentration) or 2% FBS (low serum concentration). Protein expression was assayed by anti-S6K1 and anti-phospho-S6 immunoblotting. Kinase activity was assayed by anti-S6K1 immune complex assay with GST-S6 as a substrate. (B) Equal numbers of parental, pMV7, or S6K1-overexpressing C2C12 cells were plated at day 0 in DMEM-2% FBS, and cell numbers were determined at days 2, 4, 5, and 6.
FIG. 8.
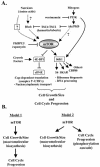
Models. (A) mTOR functions as a central coordinator of mTOR-dependent cell growth/cell size and cell cycle progression. The mTOR kinase regulates at least two downstream signaling pathways, the S6K1 and 4E-BP1/eIF4E pathways, that promote (i) cell growth and/or size and (ii) cell cycle progression when sufficient amounts of nutrients and mitogens are present. How nutrients regulate mTOR is poorly understood. Rheb was recently identified as a positive upstream regulator of mTOR that likely integrates nutrient and mitogen signals. The TSC1/TSC2 tuberous sclerosis complex (hamartin/tuberin) functions as a tumor suppressor to inhibit mTOR-dependent signaling in the absence of sufficient mitogens via inactivation of Rheb through the GAP activity of TSC2 (tuberin). Growth factors, via Akt/PKB-dependent phosphorylation of TSC2, inhibit the repressive action of the TSC1/TSC2 complex on Rheb, thus promoting mTOR-dependent signaling. (B) Models describing how mTOR couples cell growth and cell cycle progression. In model 1, mTOR primarily controls cell growth and/or cell size through macromolecular biosynthetic processes (i.e., translation) and, as a secondary consequence, regulates the rate of cell cycle progression. In model 2, mTOR regulates (i) cell growth and/or size and (ii) cell cycle progression through distinct mechanisms, such as through macromolecular biosynthetic processes and phosphorylation cascades, respectively.
Similar articles
- Rapamycin inhibits cell motility by suppression of mTOR-mediated S6K1 and 4E-BP1 pathways.
Liu L, Li F, Cardelli JA, Martin KA, Blenis J, Huang S. Liu L, et al. Oncogene. 2006 Nov 9;25(53):7029-40. doi: 10.1038/sj.onc.1209691. Epub 2006 May 22. Oncogene. 2006. PMID: 16715128 - Phosphorylation dynamics of eukaryotic initiation factor 4E binding protein 1 (4E-BP1) is discordant with its potential to interact with eukaryotic initiation factor 4E (eIF4E).
Showkat M, Beigh MA, Bhat BB, Batool A, Andrabi KI. Showkat M, et al. Cell Signal. 2014 Oct;26(10):2117-21. doi: 10.1016/j.cellsig.2014.06.008. Epub 2014 Jun 26. Cell Signal. 2014. PMID: 24975846 - Dual inhibition by S6K1 and Elf4E is essential for controlling cellular growth and invasion in bladder cancer.
Kyou Kwon J, Kim SJ, Hoon Kim J, Mee Lee K, Ho Chang I. Kyou Kwon J, et al. Urol Oncol. 2014 Jan;32(1):51.e27-35. doi: 10.1016/j.urolonc.2013.08.005. Epub 2013 Nov 13. Urol Oncol. 2014. PMID: 24239466 - Lost in translation: a neglected mTOR target for lymphangioleiomyomatosis.
Evans JF, McCormack FX, Sonenberg N, Krymskaya VP. Evans JF, et al. Eur Respir Rev. 2023 Sep 27;32(169):230100. doi: 10.1183/16000617.0100-2023. Print 2023 Sep 30. Eur Respir Rev. 2023. PMID: 37758276 Free PMC article. Review. - The mTOR/4E-BP1/eIF4E Signalling Pathway as a Source of Cancer Drug Targets.
Maracci C, Motta S, Romagnoli A, Costantino M, Perego P, Di Marino D. Maracci C, et al. Curr Med Chem. 2022;29(20):3501-3529. doi: 10.2174/0929867329666220224112042. Curr Med Chem. 2022. PMID: 35209811 Review.
Cited by
- Dual PI3K- and mTOR-inhibitor PI-103 can either enhance or reduce the radiosensitizing effect of the Hsp90 inhibitor NVP-AUY922 in tumor cells: The role of drug-irradiation schedule.
Djuzenova CS, Fiedler V, Katzer A, Michel K, Deckert S, Zimmermann H, Sukhorukov VL, Flentje M. Djuzenova CS, et al. Oncotarget. 2016 Jun 21;7(25):38191-38209. doi: 10.18632/oncotarget.9501. Oncotarget. 2016. PMID: 27224913 Free PMC article. - Nanofiber-coated, tacrolimus-eluting sutures inhibit post-operative neointimal hyperplasia in rats.
Parikh KS, Josyula A, Inoue T, Fukunishi T, Zhang H, Omiadze R, Shi R, Yazdi Y, Hanes J, Ensign LM, Hibino N. Parikh KS, et al. J Control Release. 2023 Jan;353:96-104. doi: 10.1016/j.jconrel.2022.11.020. Epub 2022 Nov 23. J Control Release. 2023. PMID: 36375620 Free PMC article. - Cap-dependent translation initiation monitored in living cells.
Gandin V, English BP, Freeman M, Leroux LP, Preibisch S, Walpita D, Jaramillo M, Singer RH. Gandin V, et al. Nat Commun. 2022 Nov 2;13(1):6558. doi: 10.1038/s41467-022-34052-8. Nat Commun. 2022. PMID: 36323665 Free PMC article. - DEPDC5-dependent mTORC1 signaling mechanisms are critical for the anti-seizure effects of acute fasting.
Yuskaitis CJ, Modasia JB, Schrötter S, Rossitto LA, Groff KJ, Morici C, Mithal DS, Chakrabarty RP, Chandel NS, Manning BD, Sahin M. Yuskaitis CJ, et al. Cell Rep. 2022 Aug 30;40(9):111278. doi: 10.1016/j.celrep.2022.111278. Cell Rep. 2022. PMID: 36044864 Free PMC article. - Effect of cell microenvironment on the drug sensitivity of hepatocellular cancer cells.
Bhattacharya B, Huang DQ, Low SHH, Tan GH, Han MJ, Singh S, Tang B, Chang SC, Lim JSY, Omar MFM, Dan YY, Soong R. Bhattacharya B, et al. Oncotarget. 2021 Mar 30;12(7):674-685. doi: 10.18632/oncotarget.27910. eCollection 2021 Mar 30. Oncotarget. 2021. PMID: 33868588 Free PMC article.
References
- Abraham, R. T., and G. J. Wiederrecht. 1996. Immunopharmacology of rapamycin. Annu. Rev. Immunol. 14:483-510. - PubMed
- Brown, E. J., P. A. Beal, C. T. Keith, J. Chen, T. B. Shin, and S. L. Schreiber. 1995. Control of p70 S6 kinase by kinase activity of FRAP in vivo. Nature 377:441-446. - PubMed
- Brunn, G. J., C. C. Hudson, A. Sekulic, J. M. Williams, H. Hosoi, P. J. Houghton, J. C. Lawrence, Jr., and R. T. Abraham. 1997. Phosphorylation of the translational repressor PHAS-I by the mammalian target of rapamycin. Science 277:99-101. - PubMed
Publication types
MeSH terms
Substances
Grants and funding
- F32 CA69808/CA/NCI NIH HHS/United States
- R01 GM051405/GM/NIGMS NIH HHS/United States
- GM51405/GM/NIGMS NIH HHS/United States
- F32 CA069808/CA/NCI NIH HHS/United States
- T32 CA09361/CA/NCI NIH HHS/United States
- T32 CA009361/CA/NCI NIH HHS/United States
LinkOut - more resources
Full Text Sources
Other Literature Sources
Molecular Biology Databases
Miscellaneous

