The role of Brg1, a catalytic subunit of mammalian chromatin-remodeling complexes, in T cell development - PubMed (original) (raw)
The role of Brg1, a catalytic subunit of mammalian chromatin-remodeling complexes, in T cell development
Thomas C Gebuhr et al. J Exp Med. 2003.
Abstract
Mammalian SWI-SNF-related complexes use brahma-related gene 1 (Brg1) as a catalytic subunit to remodel nucleosomes and regulate transcription. Recent biochemical data has linked Brg1 function to genes important for T lymphocyte differentiation. To investigate the role of SWI-SNF-related complexes in this lineage, we ablated Brg1 function in T lymphocytes. T cell-specific Brg1-deficient mice showed profound thymic abnormalities, CD4 derepression at the double negative (DN; CD4- CD8-) stage, and a developmental block at the DN to double positive (CD4+ CD8+) transition. 5'-bromo-2'-deoxyuridine incorporation and annexin V staining establish a role for Brg1 complexes in the regulation of thymocyte cell proliferation and survival. This Brg1-dependent cell survival is specific for developing thymocytes as indicated by the presence of Brg1-deficient mature T lymphocytes that have escaped the developmental block in the thymus. However, reductions in peripheral T cell populations lead to immunodeficiency and compromised health of mutant mice. These results highlight the importance of chromatin-remodeling complexes at different stages in the development of a mammalian cell lineage.
Figures
Figure 1.
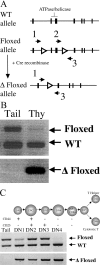
Conditional inactivation of Brg1 in developing thymocytes. (A) Schematic representation of Brg1 floxed allele. Open triangles represent position of _lox_P sites, solid boxes represent Brg1 exons, and arrows 1–3 indicate position and orientation of PCR primers used for genotype analysis in C and D. (B) Detection of Cre-mediated deletion of the Brg1 floxed allele in thymus. PCR analysis using primers (primer set 2/3 in B) that amplify both the wild-type and floxed allele (top) in whole thymus DNA preparations from +/floxed; lck-Cre mice. Loss of upper floxed allele band indicates efficient recombination of loxP sites and conversion to Δ floxed (bottom, primers set 1/3 in B). (C) Timing and efficiency of recombination during thymocyte development at the DN (CD4− CD8−) stages. TN (CD4− CD8− CD3−) thymocytes from +/floxed:lck-Cre mice were subdivided into DN1→DN4 stages. PCR analysis as described in B allowed for determination of timing of recombination (bottom) and efficiency of recombination (top) at these DN stages using tail DNA as a control.
Figure 2.
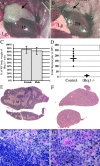
Thymic defects in tBrg1−/− mutant mice. (A and B) Gross morphology of control (A) versus tBrg1−/− mutant (B) thymi of 4-wk-old animals. Arrows indicate bi-lobed thymus above heart in upper thoracic cavity. Heart (Ht) and lung (Lg) tissue are indicated. (C) Bar graph representation of mutant body weights. Bars represent averages of tBrg1−/− weights at weaning from multiple litters (left: female, n = 5; right: male, n = 6) expressed as percent of wild-type body weight (littermate controls). (D) Total thymic cellularity (×106) in control versus tBrg1−/− mice. Solid bars represent average values of total cell counts from individual mice (♦). control, n = 8; mutant mice, n = 8. (E–H) Hematoxylin and eosin–stained sections of control (E and G) and mutant (F and H) thymus. (F) Demonstrates loss of cortico-medullary (M, medulla; Cx, cortex) architecture in the mutant thymus at low magnification (×10). (H) Arrows indicate increased apoptotic bodies (Ap) and mitotic figures (Mt) observed in tBrg1−/− thymus on higher magnification (×40).
Figure 3.
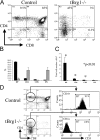
Block in T cell development at the DN stages in tBrg1−/− mice. (A) Flow cytometric analysis of CD4 versus CD8 expression on thymocytes from 4-wk-old tBrg1−/− mutant and control littermates. (B) Bar diagram showing average percentages for CD4+ CD8+ (DP), CD4 SP, CD8 SP, and CD4− CD8− (DN) subpopulations. Solid bars represent percentages from control mice (n = 9) and hatched bars represent tBrg1−/− thymic populations (n = 9). (C) Absolute cell numbers (×107/thymus) for thymocyte subsets described in B were calculated and are shown as bar diagrams. Solid bars (control) and hatched bars (tBrg1−/−) represent average values. *, statistical significance calculated using the Student's t test (p-value indicated). (D) Analysis of TCR (CD3) surface levels in CD4+ SP thymocytes in control (top) versus mutant (bottom). A low percentage of CD4 SP cells in tBrg1−/− mice express TCR compared with controls and therefore constitute immature T cells that have undergone CD4 derepression.
Figure 4.
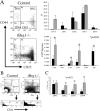
Loss of Brg1 derepresses CD4 expression and induces arrest at the DN stages of thymocyte development. (A) Flow cytometric analysis of early thymocyte precursors in control (top) versus tBrg1−/− mutant (bottom). TN (CD4− CD8− CD3−) cells were analyzed for expression of CD44 and CD25 (DN1 through DN4 stages, Fig. 1 C). Bar graph (top right) representing average percentages of the different subsets DN1, DN2, DN3, and DN4 in control (solid bars) versus mutant (hatched bars). Lower right bar graph represents absolute cell numbers (×107) for the subsets described in Fig. 1 C. tBrg1−/− mice are represented by hatched bars (n = 3) and control population are represented by solid bars (n = 3). (B) Flow sorting scheme to investigate CD4 expression at DN stages in control (left) versus tBrg1−/− mutant (right). TCR−/low cells were subdivided into DN1→DN4 (Fig. 1 C, top) and then analyzed for CD4 expression at the DN3 stage (bottom; reference 11). (C) Bar graph representing percentage of DN (DN1→DN4) cells that express CD4. Solid bars represent average value from controls (n = 3) and hatched bars represent average value from tBrg1−/− mutant (n = 3). *, p-value (Student's t test).
Figure 5.
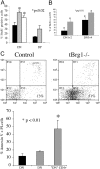
Cell proliferation and cell death at immature stages of T cell development in tBrg1−/− mice. (A) Bar graph representing average percentages of cells staining positive for BrdU incorporation on FACS®. Immature stages represent control DN (solid bar, n = 3), mutant DN (gray bar, n = 3), and mutant CD4 derepressed subpopulation (CD4+ CD8− CD3−, open bar, n = 3). *, statistical significance using Student's t test (p-value indicated). (B) Average percentage of BrdU incorporation at the DN1/DN2 and DN3/DN4 stages in control (solid bar) versus mutant (hatched bar). (C) Annexin V/PI staining of apoptotic cells on CD4+ cells from mutant versus control (top). Bar graph representation (bottom) of percentage of cell staining positive for annexin V/PI−. Solid bar indicates percentage of cells from control DN (CD4− CD8−, n = 3). Hatched bars indicate percentage of apoptotic cells from tBrg1−/− mutant in total DN and CD4 derepressed class (CD4+ CD8− CD3−, n = 3).
Figure 6.
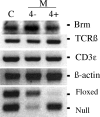
Expression analysis of Brg and TCR at the DN3 stage. RT-PCR measuring Brm, TCRβ, and CD3ɛ expression in control (C), mutant (M), CD4− (−), and CD4+ (4+) DN3 cells. β actin was used as a control for loading. The bottom represents PCR analysis (described in Fig. 1 B) to analyze Cre-mediated deletion of the floxed allele in the DN3 cell populations.
Figure 7.
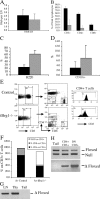
Peripheral T cell populations in tBrg1−/− mice. (A) Total LN cell counts represented in bar graph format for control (solid bars, n = 9) and mutant (hatched bars, n = 11). (B) Bar graph representation of percentages of CD3+, CD4+, and CD8+ cells in control (solid bars, n = 9) and mutant (hatched bars, n = 11) LN. (C and D) Percentages of B cells (B220+, C), and myeloid (CD11b+, D) are represented in bar graph format for control (solid bars, n = 9) and mutant (hatched bars, n = 11). (E) Flow sorting analysis for CD4 and CD8 expression on CD3+ lymphocytes (left and middle) revealing increased DN (CD4− CD8− CD3+) cell populations in mutant LNs (middle). Histogram comparing TCR (CD3) surface levels on mutant and control CD4+ cells (right). (F) Average percentage of CD4+, CD8+, and CD4− CD8− (DN) on CD3+ T cells. Increased DN percentages in mutant mice are represented by open bar. CD4+ CD3+ (solid) and CD8+ CD3+ (hatched) percentages are shown for mutant (tBrg1−/−, n = 11) and control (n = 9). (G and H) Presence of Brg1 mutant lymphocytes in the periphery. In G, whole LN DNA preparations from mutant animals were tested for amplification of the Δ floxed allele (primer set 1/3). Thymus (Thy) served as a positive control and tail DNA as a negative control. PCR analysis of flow-sorted CD4+ (CD4+ CD8− CD3−) and CD4− (CD4− CD8− CD3−) populations from tBrg1−/− animals (H) indicated a mixture of mutant cells (bottom) and unrecombined floxed (top) cells in each population.
Figure 8.
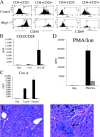
Functional characteristics of T lymphocytes from tBrg1−/− mice. (A) FACS® analysis of CD44 and CD69 on mutant and control CD4+ lymphocytes. (B–D) Proliferative response of whole LN preparation from mutant (hatched bars) and control (solid bars) LNs using CD3/CD28 antibodies (B), Con A (C), and PMA/Ion (D) stimulation. (E and F) Hematoxylin and eosin–stained liver sections from 6-mo-old control (E) and mutant (F) littermates. Arrows indicate regions of periportal lymphocyte infiltration.
Similar articles
- Brg1, the ATPase subunit of the SWI/SNF chromatin remodeling complex, is required for myeloid differentiation to granulocytes.
Vradii D, Wagner S, Doan DN, Nickerson JA, Montecino M, Lian JB, Stein JL, van Wijnen AJ, Imbalzano AN, Stein GS. Vradii D, et al. J Cell Physiol. 2006 Jan;206(1):112-8. doi: 10.1002/jcp.20432. J Cell Physiol. 2006. PMID: 15965950 - A Brg1 null mutation in the mouse reveals functional differences among mammalian SWI/SNF complexes.
Bultman S, Gebuhr T, Yee D, La Mantia C, Nicholson J, Gilliam A, Randazzo F, Metzger D, Chambon P, Crabtree G, Magnuson T. Bultman S, et al. Mol Cell. 2000 Dec;6(6):1287-95. doi: 10.1016/s1097-2765(00)00127-1. Mol Cell. 2000. PMID: 11163203 - T helper type 1-specific Brg1 recruitment and remodeling of nucleosomes positioned at the IFN-gamma promoter are Stat4 dependent.
Zhang F, Boothby M. Zhang F, et al. J Exp Med. 2006 Jun 12;203(6):1493-505. doi: 10.1084/jem.20060066. Epub 2006 May 22. J Exp Med. 2006. PMID: 16717115 Free PMC article. - When the SWI/SNF complex remodels...the cell cycle.
Muchardt C, Yaniv M. Muchardt C, et al. Oncogene. 2001 May 28;20(24):3067-75. doi: 10.1038/sj.onc.1204331. Oncogene. 2001. PMID: 11420722 Review.
Cited by
- Regulation of microRNAs by Brahma-related gene 1 (Brg1) in smooth muscle cells.
Chen M, Herring BP. Chen M, et al. J Biol Chem. 2013 Mar 1;288(9):6397-408. doi: 10.1074/jbc.M112.409474. Epub 2013 Jan 20. J Biol Chem. 2013. PMID: 23339192 Free PMC article. - The roles of SNF2/SWI2 nucleosome remodeling enzymes in blood cell differentiation and leukemia.
Prasad P, Lennartsson A, Ekwall K. Prasad P, et al. Biomed Res Int. 2015;2015:347571. doi: 10.1155/2015/347571. Epub 2015 Feb 19. Biomed Res Int. 2015. PMID: 25789315 Free PMC article. Review. - Opposing effects of SWI/SNF and Mi-2/NuRD chromatin remodeling complexes on epigenetic reprogramming by EBF and Pax5.
Gao H, Lukin K, Ramírez J, Fields S, Lopez D, Hagman J. Gao H, et al. Proc Natl Acad Sci U S A. 2009 Jul 7;106(27):11258-63. doi: 10.1073/pnas.0809485106. Epub 2009 Jun 19. Proc Natl Acad Sci U S A. 2009. PMID: 19549820 Free PMC article. - The chromatin remodeling subunit Baf200 promotes normal hematopoiesis and inhibits leukemogenesis.
Liu L, Wan X, Zhou P, Zhou X, Zhang W, Hui X, Yuan X, Ding X, Zhu R, Meng G, Xiao H, Ma F, Huang H, Song X, Zhou B, Xiong S, Zhang Y. Liu L, et al. J Hematol Oncol. 2018 Feb 26;11(1):27. doi: 10.1186/s13045-018-0567-7. J Hematol Oncol. 2018. PMID: 29482581 Free PMC article. - BRG1 Mediates Nephronectin Activation in Hepatocytes to Promote T Lymphocyte Infiltration in ConA-Induced Hepatitis.
Hong W, Kong M, Qi M, Bai H, Fan Z, Zhang Z, Sun A, Fan X, Xu Y. Hong W, et al. Front Cell Dev Biol. 2021 Jan 21;8:587502. doi: 10.3389/fcell.2020.587502. eCollection 2020. Front Cell Dev Biol. 2021. PMID: 33553140 Free PMC article.
References
- Kuo, C.T., and J.M. Leiden. 1999. Transcriptional regulation of T lymphocyte development and function. Annu. Rev. Immunol. 17:149–187. - PubMed
- Workman, J.L., and R.E. Kingston. 1998. Alteration of nucleosome structure as a mechanism of transcriptional regulation. Annu. Rev. Biochem. 67:545–579. - PubMed
- Narlikar, G.J., H.Y. Fan, and R.E. Kingston. 2002. Cooperation between complexes that regulate chromatin structure and transcription. Cell. 108:475–487. - PubMed
- Bultman, S., T. Gebuhr, D. Yee, C. La Mantia, J. Nicholson, A. Gilliam, F. Randazzo, D. Metzger, P. Chambon, G. Crabtree, et al. 2000. A Brg1 null mutation in the mouse reveals functional differences among mammalian SWI/SNF complexes. Mol. Cell. 6:1287–1295. - PubMed
Publication types
MeSH terms
Substances
LinkOut - more resources
Full Text Sources
Molecular Biology Databases
Research Materials
Miscellaneous
