Spatial analysis of 3' phosphoinositide signaling in living fibroblasts: II. Parameter estimates for individual cells from experiments - PubMed (original) (raw)
Comparative Study
Spatial analysis of 3' phosphoinositide signaling in living fibroblasts: II. Parameter estimates for individual cells from experiments
Ian C Schneider et al. Biophys J. 2004 Jan.
Abstract
Fibroblast migration is directed by gradients of platelet-derived growth factor (PDGF) during wound healing. As in other chemotactic systems, it has been shown recently that localized stimulation of intracellular phosphoinositide (PI) 3-kinase activity and production of 3' PI lipids in the plasma membrane are important events in the signaling of spatially biased motility processes. In turn, 3' PI localization depends on the effective diffusion coefficient, D, and turnover rate constant, k, of these lipids. Here we present a systematic and direct comparison of mathematical model calculations and experimental measurements to estimate the values of the effective 3' PI diffusion coefficient, D, turnover rate constant, k, and other parameters in individual fibroblasts stimulated uniformly with PDGF. In the context of our uniform stimulation model, the values of D and k in each cell were typically estimated within 10-20% or less, and the mean values across all of the cells analyzed were D = 0.37 +/- 0.25 microm2/s and k = 1.18 +/- 0.54 min(-1). In addition, we report that 3' PI turnover is not affected by PDGF receptor signaling in our cells, allowing us to focus our attention on the regulation of 3' PI production as this system is studied further.
Figures
FIGURE 1
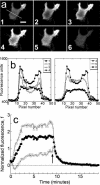
Association-dissociation experiments with TIRF excitation. (a) Total internal reflection fluorescence (TIRF) images of a representative GFP-AktPH-transfected NIH 3T3 fibroblast. Panel 1 shows the cell before treatment (scale bar = 10 _μ_m); the line scan used to generate the data is also shown. Panels 2, 3, and 4 were acquired 1, 2, and 7 min after addition of 10 nM PDGF-BB, over which time the fluorescence profile achieved a steady state. Panels 5 and 6 were acquired 0.5 and 10 min after addition of wortmannin, which rapidly blocks 3′ PI production. (b) Raw fluorescence profiles across the line scan are shown for each of the six images in a. (c) The line scan profiles at all time points, acquired every 10 s, were converted into normalized kinetic traces as described in Materials and Methods: open triangles, contact area periphery f(1,t); open inverted triangles, contact area center f(0,t); closed circles, contact area average . Time zero corresponds to the addition of PDGF, and the arrow signifies the addition of wortmannin.
FIGURE 2
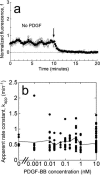
The apparent 3′ PI turnover rate constant is not altered by PDGF signaling. (a) Representative association-dissociation experiment with no PDGF added during the association phase, demonstrating that the decay of the basal 3′ PI level could be detected in our assay. Symbols are as in Fig. 1 c, and the arrow signifies the addition of wortmannin. (b) For each of 197 cells stimulated with various concentrations of PDGF-BB, the time course of the average fluorescence was fit to Eq. 3, and the apparent 3′ PI turnover rate constant, _k_app, was accepted if the fit exhibited an _R_2 value exceeding 0.95. Circle symbols are _k_app values for 168 individual cells, plotted as a function of the PDGF-BB concentration used in the association phase. The solid line connects the means at each PDGF-BB dose.
FIGURE 3
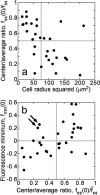
Fluorescence characteristics of individual cells subjected to the full model analysis. Of the cells imaged in association-dissociation experiments, 32 satisfied all criteria for comparison with model calculations. (a) The gradient depth of each cell, assessed through the steady-state center/average fluorescence ratio, , is a function of cell size, measured as the radius of the line scan squared. (b) Correlation of the fluorescence dip at the center of the contact area, _f_min(0) (y axis), and the steady-state center/average fluorescence ratio,
(x axis). Two cells with relatively low
yet high _f_min(0) are indicated with arrows; these are referred to again in Fig. 5.
FIGURE 4
Model fits to individual cell fluorescence tracks. (a) Limiting cases of the model were used to constrain the parameter space. A histogram for the number of cases (up to 6) satisfied is shown, and the identities of the cases are indicated (see also Table 1). (b) The quantity _χ_2/n is used to assess quality of fit, where n is the number of data points considered. The _χ_2/n value for each cell, averaged over the applicable limiting cases, is plotted versus cell size, taken as the square of the line scan radius (_μ_m2); the error bars signify the range of _χ_2/n values obtained. The four cells indicated with open symbols yielded the least ideal model fits, with average _χ_2/n > 0.10. (c) Representative cell tracks exhibiting radial gradients of varying depth. The values of are (left) 0.82, (middle) 0.53, and (right) 0.25. Symbols signify fluorescence measurements as in Fig. 1 c, and solid curves are the best-fit model calculations.
FIGURE 5
Estimates of the 3′ PI diffusion coefficient, turnover rate constant, and other parameters in individual cells. Circle symbols mark the mean parameter value averaged over the limiting model fits, and the error bars signify the range of parameter values for each cell. Open symbols signify the four cells that yielded less ideal model fits as described under Fig. 4. (a) The estimated diffusion coefficient D (_μ_m2/s) in each cell is plotted versus the square of the line scan radius (_μ_m2), demonstrating that the apparent lipid mobility is independent of cell size. The dotted line indicates the mean of the 32 cells (0.374 _μ_m2/s). (b) The average turnover rate constant, k, is correlated versus the associated _k_app, from a fit to Eq. 3, for each cell. The solid line is the best fit of the data to y = m*x, with m = 1.75; the dashed line is the y = x line. (c) The fluorescence gain, σ, the ratio of the cytosolic volume to the effective volume of TIRF excitation, is plotted versus the square of the line scan radius (_μ_m2). (d) The estimated values of basal/steady-state 3′ PI ratio, _X_0/_X_ss (x axis), and the steady-state probe-binding fraction, _p_ss (y axis), are shown.
Similar articles
- Spatial analysis of 3' phosphoinositide signaling in living fibroblasts: I. Uniform stimulation model and bounds on dimensionless groups.
Haugh JM, Schneider IC. Haugh JM, et al. Biophys J. 2004 Jan;86(1 Pt 1):589-98. doi: 10.1016/S0006-3495(04)74137-5. Biophys J. 2004. PMID: 14695303 Free PMC article. - Spatial analysis of 3' phosphoinositide signaling in living fibroblasts, III: influence of cell morphology and morphological Polarity.
Schneider IC, Parrish EM, Haugh JM. Schneider IC, et al. Biophys J. 2005 Aug;89(2):1420-30. doi: 10.1529/biophysj.105.061218. Epub 2005 May 27. Biophys J. 2005. PMID: 15923219 Free PMC article. - Deterministic model of dermal wound invasion incorporating receptor-mediated signal transduction and spatial gradient sensing.
Haugh JM. Haugh JM. Biophys J. 2006 Apr 1;90(7):2297-308. doi: 10.1529/biophysj.105.077610. Epub 2006 Jan 13. Biophys J. 2006. PMID: 16415056 Free PMC article. - PDGF and neomycin induce similar changes in the actin cytoskeleton in human fibroblasts.
Hedberg KM, Bengtsson T, Safiejko-Mroczka B, Bell PB, Lindroth M. Hedberg KM, et al. Cell Motil Cytoskeleton. 1993;24(2):139-49. doi: 10.1002/cm.970240207. Cell Motil Cytoskeleton. 1993. PMID: 8440026 - Signaling mechanisms in growth factor-stimulated cell motility.
Anand-Apte B, Zetter B. Anand-Apte B, et al. Stem Cells. 1997;15(4):259-67. doi: 10.1002/stem.150259. Stem Cells. 1997. PMID: 9253109 Review.
Cited by
- PLEKHG3 enhances polarized cell migration by activating actin filaments at the cell front.
Nguyen TT, Park WS, Park BO, Kim CY, Oh Y, Kim JM, Choi H, Kyung T, Kim CH, Lee G, Hahn KM, Meyer T, Heo WD. Nguyen TT, et al. Proc Natl Acad Sci U S A. 2016 Sep 6;113(36):10091-6. doi: 10.1073/pnas.1604720113. Epub 2016 Aug 23. Proc Natl Acad Sci U S A. 2016. PMID: 27555588 Free PMC article. - F-actin bundles direct the initiation and orientation of lamellipodia through adhesion-based signaling.
Johnson HE, King SJ, Asokan SB, Rotty JD, Bear JE, Haugh JM. Johnson HE, et al. J Cell Biol. 2015 Feb 16;208(4):443-55. doi: 10.1083/jcb.201406102. Epub 2015 Feb 9. J Cell Biol. 2015. PMID: 25666809 Free PMC article. - Live-cell fluorescence microscopy with molecular biosensors: what are we really measuring?
Haugh JM. Haugh JM. Biophys J. 2012 May 2;102(9):2003-11. doi: 10.1016/j.bpj.2012.03.055. Biophys J. 2012. PMID: 22824263 Free PMC article. - Migrating fibroblasts reorient directionality by a metastable, PI3K-dependent mechanism.
Welf ES, Ahmed S, Johnson HE, Melvin AT, Haugh JM. Welf ES, et al. J Cell Biol. 2012 Apr 2;197(1):105-14. doi: 10.1083/jcb.201108152. J Cell Biol. 2012. PMID: 22472441 Free PMC article. - How cells integrate complex stimuli: the effect of feedback from phosphoinositides and cell shape on cell polarization and motility.
Marée AF, Grieneisen VA, Edelstein-Keshet L. Marée AF, et al. PLoS Comput Biol. 2012;8(3):e1002402. doi: 10.1371/journal.pcbi.1002402. Epub 2012 Mar 1. PLoS Comput Biol. 2012. PMID: 22396633 Free PMC article.
References
- Axelrod, D. 2001. Total internal reflection fluorescence microscopy in cell biology. Traffic. 2:764–774. - PubMed
- Chung, C. Y., S. Funamoto, and R. A. Firtel. 2001. Signaling pathways controlling cell polarity and chemotaxis. Trends Biochem. Sci. 26:557–566. - PubMed
- Cullen, P. J., G. E. Cozier, G. Banting, and H. Mellor. 2001. Modular phosphoinositide-binding domains: their role in signalling and membrane trafficking. Curr. Biol. 11:R882–R893. - PubMed
- Devreotes, P. N., and S. H. Zigmond. 1988. Chemotaxis in eukaryotic cells: a focus on leukocytes and Dictyostelium. Annu. Rev. Cell Biol. 4:649–686. - PubMed
- Funamoto, S., R. Meili, S. Lee, L. Parry, and R. A. Firtel. 2002. Spatial and temporal regulation of 3-phosphoinositides by PI 3-kinase and PTEN mediates chemotaxis. Cell. 109:611–623. - PubMed
Publication types
MeSH terms
Substances
LinkOut - more resources
Full Text Sources
Research Materials
Miscellaneous


