Monitoring protein stability and aggregation in vivo by real-time fluorescent labeling - PubMed (original) (raw)
Monitoring protein stability and aggregation in vivo by real-time fluorescent labeling
Zoya Ignatova et al. Proc Natl Acad Sci U S A. 2004.
Abstract
In vivo fluorescent labeling of an expressed protein has enabled the observation of its stability and aggregation directly in bacterial cells. Mammalian cellular retinoic acid-binding protein I (CRABP I) was mutated to incorporate in a surface-exposed omega loop the sequence Cys-Cys-Gly-Pro-Cys-Cys, which binds specifically to a biarsenical fluorescein dye (FlAsH). Unfolding of labeled tetra-Cys CRABP I is accompanied by enhancement of FlAsH fluorescence, which made it possible to determine the free energy of unfolding of this protein by urea titration in cells and to follow in real time the formation of inclusion bodies by a slow-folding, aggregationprone mutant (FlAsH-labeled P39A tetra-Cys CRABP I). Aggregation in vivo displayed a concentration-dependent apparent lag time similar to observations of protein aggregation in purified in vitro model systems.
Figures
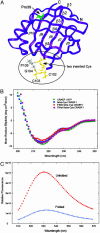
Fig. 1.
(A) Backbone structure of CRABP I (rendered by using
insight
II from PBD file 1CBI) showing the point of insertion of the tetra-Cys motif between strands β7 and β8 in the omega loop (circled) and the location of P39, at the end of the second α-helix. (B) CD spectra comparing CRABP I WT*, tetra-Cys CRABP I, P39A tetra-Cys CRABP I, and FlAsH-labeled tetra-Cys CRABP I. (C) fluorescence of FlAsH-labeled tetra-Cys CRABP I (excitation 500 nm) in its native folded state and denatured by 8 M urea (unfolded), showing the hyperfluorescence of the unfolded state.
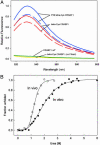
Fig. 2.
(A) FlAsH labeling of tetra-Cys CRABP I and P39A tetra-Cys CRABP I in E. coli cells. Before IPTG induction of protein expression, cells were treated with dye, either after lysozyme pretreatment (solid lines) or not (dashed lines). Spectra shown were obtained 4 h after induction. (B) Urea denaturation curves monitored using fluorescence of FlAsH-labeled tetra-Cys CRABP I (excitation 500 nm, emission 530). For the in vivo curve, urea was added to the indicated concentration 2 h after induction of protein expression in cells preloaded with FlAsH.
Fig. 3.
(A) Time course of FlAsH fluorescence at 530 nm after lysozyme pretreatment, loading with dye, and IPTG induction of protein expression at time 0 (tetra-Cys CRABP I in red, P39A tetra-Cys CRABP I in blue; filled symbols). Cell density (OD600) is shown in open symbols in the same colors. (B) Time evolution of P39A tetra-Cys CRABP I protein distribution between soluble and insoluble fractions from cell fractionation (note that all of the tetra-Cys CRABP I remains soluble throughout the same time course). (C) Fluorescence microscopy of cells at 60 min (Left) or 240 min (Right) postinduction showing increasing number of highly fluorescent inclusion bodies with polar distribution. (D) Effect of chloramphenicol (Chlm) treatment at a concentration that reduces translation (and therefore concentration of expressed protein) on the time course of FlAsH-labeled P39A tetra-Cys CRABP I fluorescence. Note the longer apparent lag time in the presence of chloramphenicol (⋄) before the striking increase in fluorescence of FlAsH-labeled P39A tetra-Cys CRABP I.
Similar articles
- Aggregation of a slow-folding mutant of a beta-clam protein proceeds through a monomeric nucleus.
Ignatova Z, Gierasch LM. Ignatova Z, et al. Biochemistry. 2005 May 17;44(19):7266-74. doi: 10.1021/bi047404e. Biochemistry. 2005. PMID: 15882065 - Effects of osmolytes on protein folding and aggregation in cells.
Ignatova Z, Gierasch LM. Ignatova Z, et al. Methods Enzymol. 2007;428:355-72. doi: 10.1016/S0076-6879(07)28021-8. Methods Enzymol. 2007. PMID: 17875429 - Cross-strand split tetra-Cys motifs as structure sensors in a beta-sheet protein.
Krishnan B, Gierasch LM. Krishnan B, et al. Chem Biol. 2008 Oct 20;15(10):1104-15. doi: 10.1016/j.chembiol.2008.09.006. Chem Biol. 2008. PMID: 18940670 Free PMC article. - Exploration of biarsenical chemistry--challenges in protein research.
Pomorski A, Krężel A. Pomorski A, et al. Chembiochem. 2011 May 16;12(8):1152-67. doi: 10.1002/cbic.201100114. Epub 2011 Apr 28. Chembiochem. 2011. PMID: 21538762 Review. - Imaging protein-protein interactions using fluorescence resonance energy transfer microscopy.
Kenworthy AK. Kenworthy AK. Methods. 2001 Jul;24(3):289-96. doi: 10.1006/meth.2001.1189. Methods. 2001. PMID: 11403577 Review.
Cited by
- Crowding effects on the small, fast-folding protein lambda6-85.
Denos S, Dhar A, Gruebele M. Denos S, et al. Faraday Discuss. 2012;157:451-62; discussion 475-500. doi: 10.1039/c2fd20009k. Faraday Discuss. 2012. PMID: 23230782 Free PMC article. - Dispose to the pole-protein aggregation control in bacteria.
Zietkiewicz S, Liberek K. Zietkiewicz S, et al. EMBO J. 2010 Mar 3;29(5):869-70. doi: 10.1038/emboj.2010.12. EMBO J. 2010. PMID: 20197791 Free PMC article. No abstract available. - A segmental labeling strategy for unambiguous determination of domain-domain interactions of large multi-domain proteins.
Chen J, Wang J. Chen J, et al. J Biomol NMR. 2011 Aug;50(4):403-10. doi: 10.1007/s10858-011-9526-0. Epub 2011 Jul 6. J Biomol NMR. 2011. PMID: 21732209 - From the test tube to the cell: exploring the folding and aggregation of a beta-clam protein.
Ignatova Z, Krishnan B, Bombardier JP, Marcelino AM, Hong J, Gierasch LM. Ignatova Z, et al. Biopolymers. 2007;88(2):157-63. doi: 10.1002/bip.20665. Biopolymers. 2007. PMID: 17206628 Free PMC article. - Conformational detection of p53's oligomeric state by FlAsH Fluorescence.
Webber TM, Allen AC, Ma WK, Molloy RG, Kettelkamp CN, Dow CA, Gage MJ. Webber TM, et al. Biochem Biophys Res Commun. 2009 Jun 19;384(1):66-70. doi: 10.1016/j.bbrc.2009.04.073. Epub 2009 Apr 23. Biochem Biophys Res Commun. 2009. PMID: 19393630 Free PMC article.
References
- Betts, S., Haase-Pettingell, C. & King, J. A. (1997) Adv. Prot. Chem. 50, 243–264. - PubMed
- Fink, A. L. (1998) Folding Des. 3, R9–R23. - PubMed
- Zhang, J., Campbell, R. E., Ting, A. Y. & Tsien, R. Y. (2002) Nat. Rev. Mol. Cell Biol. 3, 906–918. - PubMed
- Banaszak, L., Winter, N., Xu, Z., Bernlohr, D. A., Cowan, S. & Jones, T. A. (1994) Adv. Protein Chem. 45, 89–151. - PubMed
Publication types
MeSH terms
Substances
LinkOut - more resources
Full Text Sources
Other Literature Sources


