Critical roles of TRAIL in hepatic cell death and hepatic inflammation - PubMed (original) (raw)
Critical roles of TRAIL in hepatic cell death and hepatic inflammation
Shi-Jun Zheng et al. J Clin Invest. 2004 Jan.
Abstract
The TNF-related apoptosis-inducing ligand (TRAIL) induces apoptosis of tumor cells but not most normal cells. Its role in hepatic cell death and hepatic diseases is not clear. In vitro studies suggest that murine hepatocytes are not sensitive to TRAIL-induced apoptosis, indicating that TRAIL may not mediate hepatic cell death. Using two experimental models of hepatitis, we found that hepatic cell death in vivo was dramatically reduced in TRAIL-deficient mice and mice treated with a blocking TRAIL receptor. Although both TRAIL and its death receptor 5 were constitutively expressed in the liver, TRAIL expression by immune cells alone was sufficient to restore the sensitivity of TRAIL-deficient mice to hepatitis. Thus, TRAIL plays a crucial role in hepatic cell death and hepatic inflammation.
Figures
Figure 1
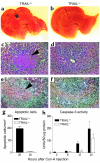
TRAIL–/– mice are resistant to Con-A–induced hepatitis. Normal (TRAIL+/+) and TRAIL-deficient (TRAIL–/–) BALB/c mice, five per group, were injected once with Con-A (25 mg/kg of body weight) to induce hepatitis as described in Methods. Mice were sacrificed at different time points after the Con-A injection, and livers were harvested and tested as described in Methods. (a and b) Livers from TRAIL+/+ and TRAIL–/– mice, respectively, 24 hours after Con-A injection. (c and d) H&E staining of liver sections from TRAIL+/+ and TRAIL–/– mice, respectively, 24 hours after Con-A injection. The arrowhead indicates massive cell death in the TRAIL+/+ liver section. Original magnification, ×200. (e and f) TUNEL staining of liver sections from TRAIL+/+ and TRAIL–/– mice, respectively, 24 hours after Con-A injection. The arrowhead indicates an aggregate of apoptotic cells in the TRAIL+/+ liver section (apoptotic nuclei are shown in brown). Original magnification, ×200. (g) Numbers of apoptotic cells per square millimeter of liver sections of TRAIL+/+ and TRAIL–/– mice 24 hours after Con-A injection. The difference between the two groups is statistically significant (P < 0.0001). (h) Caspase-3 activity in the liver cytosolic protein extract at different time points after Con-A injection. The difference between the two groups is statistically significant (P < 0.01). Results shown are from one representative experiment of three.
Figure 2
Serum transaminase and liver fibrosis in Con-A–induced hepatitis. (a–d) Normal (TRAIL+/+) and TRAIL-deficient (TRAIL–/–) BALB/c mice, five per group, were injected once with Con-A (0–25 mg/kg of body weight) as described in Methods. Serum transaminase levels were determined 8 and 24 hours after the Con-A injection. The ALT and AST levels are presented in Sigma-Frankel units. The differences between the two groups are statistically significant as determined by ANOVA (P < 0.001). (e–g) TRAIL–/– and TRAIL+/+ mice, three per group, were injected with a low dose of Con-A (8 mg/kg of body weight) in PBS once a week for 6 consecutive weeks (25). Control mice received only PBS injections. One week after the last injection, mice were sacrificed and serum transaminase activities determined (e and f). The degree of fibrosis was determined by measurement of the amount of collagen per milligram of total liver proteins as previously described (24). The differences between the two groups after Con-A injections are statistically significant (P < 0.05) for AST and ALT, but not for collagen.
Figure 3
TRAIL blockade protects mice from Con-A–induced hepatitis. TRAIL+/+ BALB/c mice, five per group, were injected intraperitoneally with either soluble DR5 (sDR5) or control protein BSA (300 μg/mouse). One hour later, mice were challenged with Con-A (25 mg/kg of body weight), and serum ALT activities were assessed 8 and 24 hours after the challenge. Data presented are means and SEM of all mice. Results shown are from one representative experiment of two. The differences between the two groups are statistically significant as determined by ANOVA (P < 0.01).
Figure 4
TRAIL and TRAIL receptor gene expressions in Con-A–induced hepatitis. Mice were treated as described in the legend to Figure 1, perfused, and sacrificed at indicated hours after Con-A injection. DR5, TRAIL, and GAPDH gene expressions were determined by Northern blot as described in Methods. Numbers under each lane represent fold changes over signals obtained at 0 hours.
Figure 5
TRAIL expression by cells of the immune system is required for the development of Con-A–induced hepatitis. TRAIL+/+ or TRAIL–/– liver MNCs (2 × 10⁷ cells per mouse) and splenocytes (3 × 10⁷ cells per mouse) were transferred into TRAIL–/– mice intrahepatically and intrasplenically, respectively. One hour later, mice were injected with Con-A (25 mg/kg of body weight), and serum activities of ALT were assessed 12 hours after the challenge. Data presented are means and SEM of each group (n = 5). Results shown are from one representative experiment of two. The differences between the two groups are statistically significant as determined by ANOVA (P < 0.01).
Figure 6
TRAIL–/– mice are resistant to _Listeria-_induced hepatitis. Groups of TRAIL+/+ and TRAIL–/– BALB/c mice, five per group, were injected intravenously with 1 × 10⁴ CFUs per mouse of L. monocytogenes. Mice were sacrificed at different times, and their livers were collected and embedded in paraffin. Tissue sections were then prepared and stained by TUNEL as described in Methods. (a) TUNEL staining of liver sections. (b) Quantitative analysis of cell death in the liver. Data presented are means and SEM of each group (n = 5). (c and d) Levels of serum transaminases were determined as described in Methods. Results shown are from one representative experiment of four. The differences between the two groups after Listeria infections are statistically significant as determined by ANOVA (P < 0.05).
Figure 7
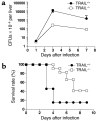
L. monocytogenes counts in the liver and mouse survival rates. (a) Two groups of BALB/c mice (n = 5) were treated as described in the legend to Figure 6 and sacrificed 1, 3, and 7 days after Listeria infection. The total number of bacteria in the liver and spleen was determined as described in Methods. Results shown are from one representative experiment of four. The differences between the two groups are statistically significant for days 3 and 7 as determined by ANOVA (P < 0.0001). (b) TRAIL+/+ (n = 13) and TRAIL–/– (n = 12) BALB/c mice were infected with 5 × 10⁴ CFUs of L. monocytogenes as described in the legend to Figure 6. Data shown are survival rates of TRAIL+/+ and TRAIL–/– mice pooled from four independent experiments. The difference between the two groups is statistically significant as determined by Mann-Whitney test (P < 0.01).
Similar articles
- Reduced apoptosis and ameliorated listeriosis in TRAIL-null mice.
Zheng SJ, Jiang J, Shen H, Chen YH. Zheng SJ, et al. J Immunol. 2004 Nov 1;173(9):5652-8. doi: 10.4049/jimmunol.173.9.5652. J Immunol. 2004. PMID: 15494516 - Tumor necrosis factor-related apoptosis-inducing ligand-mediated apoptosis is an important endogenous mechanism for resistance to liver metastases in murine renal cancer.
Seki N, Hayakawa Y, Brooks AD, Wine J, Wiltrout RH, Yagita H, Tanner JE, Smyth MJ, Sayers TJ. Seki N, et al. Cancer Res. 2003 Jan 1;63(1):207-13. Cancer Res. 2003. PMID: 12517799 - TRAIL receptor-mediated JNK activation and Bim phosphorylation critically regulate Fas-mediated liver damage and lethality.
Corazza N, Jakob S, Schaer C, Frese S, Keogh A, Stroka D, Kassahn D, Torgler R, Mueller C, Schneider P, Brunner T. Corazza N, et al. J Clin Invest. 2006 Sep;116(9):2493-9. doi: 10.1172/JCI27726. J Clin Invest. 2006. PMID: 16955144 Free PMC article. - TRAIL and NFkappaB signaling--a complex relationship.
Wajant H. Wajant H. Vitam Horm. 2004;67:101-32. doi: 10.1016/S0083-6729(04)67007-5. Vitam Horm. 2004. PMID: 15110174 Review. - TRAIL-induced signalling and apoptosis.
MacFarlane M. MacFarlane M. Toxicol Lett. 2003 Apr 4;139(2-3):89-97. doi: 10.1016/s0378-4274(02)00422-8. Toxicol Lett. 2003. PMID: 12628743 Review.
Cited by
- Essential role of TNF family molecule LIGHT as a cytokine in the pathogenesis of hepatitis.
Anand S, Wang P, Yoshimura K, Choi IH, Hilliard A, Chen YH, Wang CR, Schulick R, Flies AS, Flies DB, Zhu G, Xu Y, Pardoll DM, Chen L, Tamada K. Anand S, et al. J Clin Invest. 2006 Apr;116(4):1045-51. doi: 10.1172/JCI27083. Epub 2006 Mar 23. J Clin Invest. 2006. PMID: 16557300 Free PMC article. - TRAIL-R deficiency in mice promotes susceptibility to chronic inflammation and tumorigenesis.
Finnberg N, Klein-Szanto AJ, El-Deiry WS. Finnberg N, et al. J Clin Invest. 2008 Jan;118(1):111-23. doi: 10.1172/JCI29900. J Clin Invest. 2008. PMID: 18079962 Free PMC article. - Inhibition of immune checkpoints PD-1, CTLA-4, and IDO1 coordinately induces immune-mediated liver injury in mice.
Affolter T, Llewellyn HP, Bartlett DW, Zong Q, Xia S, Torti V, Ji C. Affolter T, et al. PLoS One. 2019 May 21;14(5):e0217276. doi: 10.1371/journal.pone.0217276. eCollection 2019. PLoS One. 2019. PMID: 31112568 Free PMC article. - Annexin V-TRAIL fusion protein is a more sensitive and potent apoptotic inducer for cancer therapy.
Qiu F, Hu M, Tang B, Liu X, Zhuang H, Yang J, Hua ZC. Qiu F, et al. Sci Rep. 2013 Dec 20;3:3565. doi: 10.1038/srep03565. Sci Rep. 2013. PMID: 24356445 Free PMC article. - The C5a anaphylatoxin receptor (C5aR1) protects against Listeria monocytogenes infection by inhibiting type 1 IFN expression.
Calame DG, Mueller-Ortiz SL, Morales JE, Wetsel RA. Calame DG, et al. J Immunol. 2014 Nov 15;193(10):5099-107. doi: 10.4049/jimmunol.1401750. Epub 2014 Oct 8. J Immunol. 2014. PMID: 25297874 Free PMC article.
References
- Ksontini R, et al. Disparate roles for TNF-alpha and Fas ligand in concanavalin A-induced hepatitis. J. Immunol. 1998;160:4082–4089. - PubMed
- Ando K, et al. Perforin, Fas/Fas ligand, and TNF-alpha pathways as specific and bystander killing mechanisms of hepatitis C virus-specific human CTL. J. Immunol. 1997;158:5283–5291. - PubMed
- Kondo T, Suda T, Fukuyama H, Adachi M, Nagata S. Essential roles of the Fas ligand in the development of hepatitis. Nat. Med. 1997;3:409–413. - PubMed
- Chirmule N, et al. Fas-Fas ligand interactions play a major role in effector functions of cytotoxic T lymphocytes after adenovirus vector-mediated gene transfer. Hum. Gene Ther. 1999;10:259–269. - PubMed
- Wiley SR, et al. Identification and characterization of a new member of the TNF family that induces apoptosis. Immunity. 1995;3:673–682. - PubMed
Publication types
MeSH terms
Substances
Grants and funding
- R01 AI050059/AI/NIAID NIH HHS/United States
- AI55934/AI/NIAID NIH HHS/United States
- R01 AI055934/AI/NIAID NIH HHS/United States
- R56 AI050059/AI/NIAID NIH HHS/United States
- AI055934/AI/NIAID NIH HHS/United States
- AI50059/AI/NIAID NIH HHS/United States
- NS40188/NS/NINDS NIH HHS/United States
LinkOut - more resources
Full Text Sources
Other Literature Sources
Molecular Biology Databases


