The differential roles of budding yeast Tem1p, Cdc15p, and Bub2p protein dynamics in mitotic exit - PubMed (original) (raw)
The differential roles of budding yeast Tem1p, Cdc15p, and Bub2p protein dynamics in mitotic exit
Jeffrey N Molk et al. Mol Biol Cell. 2004 Apr.
Abstract
In the budding yeast Saccharomyces cerevisiae the mitotic spindle must be positioned along the mother-bud axis to activate the mitotic exit network (MEN) in anaphase. To examine MEN proteins during mitotic exit, we imaged the MEN activators Tem1p and Cdc15p and the MEN regulator Bub2p in vivo. Quantitative live cell fluorescence microscopy demonstrated the spindle pole body that segregated into the daughter cell (dSPB) signaled mitotic exit upon penetration into the bud. Activation of mitotic exit was associated with an increased abundance of Tem1p-GFP and the localization of Cdc15p-GFP on the dSPB. In contrast, Bub2p-GFP fluorescence intensity decreased in mid-to-late anaphase on the dSPB. Therefore, MEN protein localization fluctuates to switch from Bub2p inhibition of mitotic exit to Cdc15p activation of mitotic exit. The mechanism that elevates Tem1p-GFP abundance in anaphase is specific to dSPB penetration into the bud and Dhc1p and Lte1p promote Tem1p-GFP localization. Finally, fluorescence recovery after photobleaching (FRAP) measurements revealed Tem1p-GFP is dynamic at the dSPB in late anaphase. These data suggest spindle pole penetration into the bud activates mitotic exit, resulting in Tem1p and Cdc15p persistence at the dSPB to initiate the MEN signal cascade.
Figures
Figure 1.
Time-lapse series of anaphase in haploid wild-type (A and B) and _ase1_Δ mutant (C and D) cells expressing a GFP-Tub1p (Bar, 2 μm). (A) An example of an early contact event between the SPB and the distal bud cortex, relative to the mean value of the population, in a wild-type cell. Early spindle pole body-cortical contact (3.0 min, red arrow), septation (21.6 min, yellow arrow), and cell separation (43.7 min) from the time of spindle pole body entry into the bud (0.0 min). (B) An example of a late contact event between the SPB and the distal bud cortex, relative to the mean population value, in a wild-type cell. Late spindle pole body-cortical contact (9.7 min, red arrow), septation (21.8 min, yellow arrow), and cell separation (46.8 min) from the time of spindle pole body entry into the bud (0.0 min). (C) An example of an early contact event in an _ase1_Δ cell. Early spindle pole body-cortical contact (2.9 min, red arrow), septation (24.1 min, yellow arrow), and cell separation (51.7 min) from the time of spindle pole body entry into the bud (0.0 min). (D) An example of a late contact event in an _ase1_Δ cell. Late spindle pole body-cortical contact (12.3 min, red arrow), septation (24.8 min, yellow arrow), and cell separation (45.8 min) from the time of spindle pole body entry into the bud (0.0 min).
Figure 2.
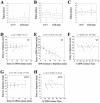
The timing of mitotic exit correlates best with entry of the daughter spindle pole body into the bud and is not affected by premature spindle collapse. The box plots in A to C display the upper and lower quartiles as the boundaries of the box with the horizontal line inside the box denoting the median. The whiskers indicate the boundaries of the outliers which are represented by small circles and were defined by data greater than the quantity (upper quartile + [1.5*interquartile distance]) or less than (lower quartile - [1.5*interquartile distance]). wt denotes wild-type cells analyzed. n = 56 wt cells and 50 _ase1_Δ cells. (A) The time of spindle pole body entry into the bud to cortical contact is not different in an _ase1_Δ mutant compared with wild-type (p = 0.3408 < 0.9500). (B) The time of daughter cell cortical contact to septation is not different in an _ase1_Δ mutant from wild-type (p = 0.4408 < 0.9500). (C) The timing of spindle pole body entry into the bud to septation in an _ase1_Δ mutant is not different from wild-type (p = 0.8773 < 0.9500). (D) There is no correlation between spindle pole body contact with the bud cortex and the timing of the initiation of septation in wild-type cells (slope of 0.086 ± 0.212; mean ± SE). (E) There is negative correlation between the timing of spindle pole body contact with the bud cortex and the time between cortical contact and the initiation of septation in wild-type cells (slope of -0.914 ± 0.212). (F) There is no correlation between the duration of the spindle pole body contact with the bud cortex and the initiation of septation in wild-type cells (slope of 0.000 ± 0.066). (G) There is no correlation between spindle pole body contact with the bud cortex and the initiation of septation in _ase1_Δ cells (slope of 0.192 ± 0.219). (H) There is no correlation between the duration of the spindle pole body contact with the bud cortex and the initiation of septation in _ase1_Δ cells (slope of -0.005 ± 0.093).
Figure 3.
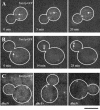
Tem1p-GFP accumulates in response to spatial positioning during mitosis (Bar, 5 μm). (A) Cell undergoing spindle rotation before anaphase expressing Tem1p-GFP. Arrow indicates mSPB. (0 min) The mitotic spindle is oriented parallel to the bud neck and one SPB was preferentially labeled with Tem1p-GFP. (5 min) Spindle positioning altered Tem1p-GFP fluorescence intensity. (20 min) As spindle rotation is completed Tem1p-GFP clearly localized preferentially to the dSPB. (B) Tem1p-GFP localization during anaphase elongation of the mitotic spindle. Arrow denotes dSPB. (0 min) Tem1p-GFP labeled the mSPB at an apparent equal intensity to Tem1p-GFP on the dSPB. (14 min) On spindle elongation Tem1p-GFP was dim on the mSPB but intensely labeled the dSPB. (28 min) Tem1p-GFP appeared to increase in fluorescence intensity in late anaphase on the dSPB. (C) Three representative _dhcl_Δ cells expressing Tem1p-GFP with elongated spindles in the mother cell.
Figure 4.
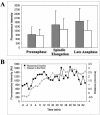
Fluorescence intensity measurements of Tem1p-GFP. (A) Fluorescence intensity measurements of Tem1p during mitosis. mSPBs are overestimated as those cells with no mSPB focus were not accounted for. Error bars indicate SD for each measurement. dSPB (▪): n = 38 (preanaphase), 23 (spindle elongation), and 50 (late anaphase). mSPB (□): n = = 20 (preanaphase), 27 (spindle elongation), and 39 (late anaphase). (B) Average distance and intensity measurements for Tem1p-GFP of nine cells during spindle elongation. Black squares, average relative Tem1p-GFP fluorescence intensity in arbitrary units (AU); gray triangles, average distance from the Tem1p-GFP focus to the center of the bud neck in microns. Spindle lengths based on distance from dSPB to transient mSPBs labeled with Tem1p-GFP: preanaphase, 1.99 μm; 0–10 min, 3.47 μm; 12–20 min, 5.14 μm; 22–30 min, 5.83 μm; and ≥32 min, 6.84 μm.
Figure 5.
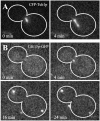
Live cell localization of Cdc15p-GFP during anaphase (Bar, 5 μm). (A) Mitotic spindle elongation marked by CFP-Tub1p. The frame before spindle extension, visualized by CFP-Tub1p, was designated as the initial time point in this experiment. Penetration of the bud neck occurred at t = 4 min. (B) Cdc15p-GFP localization during anaphase spindle elongation. (0 min) Cdc15p-GFP does not localize to SPBs. (4 min) On mitotic spindle elongation Cdc15p-GFP accumulates on the dSPB. (16 min, 24 min) Accumulation of Cdc15p-GFP occurred on both SPBs in late anaphase.
Figure 6.
Bub2p-GFP fluorescence intensity analysis. (A) Bub2p-GFP localization in living cells. DIC image is inset to fluorescence image (Bar, 5 μm for fluorescence image). (0 min, 2 min) Bub2p-GFP localizes to both SPBs. (11 min, 16 min) Bub2p-GFP increases on the dSPB and is lost from the mSPB. (21 min, 25 min) Bub2p-GFP is lost from the dSPB. (B) Example of Bub2p-GFP fluorescence intensity decrease on the dSPB in midanaphase. Large gray arrow, spindle elongation; black arrow, maximum spindle extension. Black squares, fluorescence intensity in arbitrary units (AU); gray triangles, distance to bud neck in micrometers. (C) Example of Bub2p-GFP fluorescence intensity decrease on the dSPB in late anaphase. Large gray arrow, spindle elongation; black arrow, maximum spindle extension. Black squares, fluorescence intensity in arbitrary units (AU); gray triangles, distance to bud neck in microns. (D) Summary of Tem1p-GFP, Spc29p-GFP, and Bub2p-GFP quantitative measurements. Arbitrary fluorescence intensity scale is derived from the approximate fluorescence intensity of each probe as measured in the previous figures.
Figure 7.
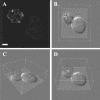
Native level Lte1p-3xGFP is localized to the daughter cell cortex. (A) An example of a deconvolved cell in two dimensions (Bar, 2 μm). (B–D) Projections of the three-dimensional image show that all of the Lte1p-3xGFP is localized to the periphery of the cell next to the cortex and is not associated with any internal structure within the bud.
Figure 8.
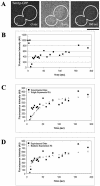
FRAP of Tem1p-GFP in late anaphase. Fluorescence intensity is recorded in arbitrary units (AU). (A) Prebleach t = -3 s; time of photobleaching t = 0 s; recovery t = 160 s (Bar, 5 μm). (B) Quantified recovery of fluorescence for the same dSPB photobleached in A. (C) Comparison of experimental data (black squares) with single exponential best-fit data (gray triangles). (D) Comparison of experimental data (black squares) with biphasic exponential best fit data (gray triangles). See MATERIALS AND METHODS for details of analysis.
Figure 9.
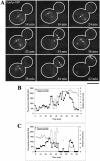
Spindle reorientation results in accumulation of Tem1p-GFP on the SPB that enters the bud in _kar9_Δ mutants. (A) Selected frames from a movie showing changes in Tem1p-GFP fluorescence intensity during active reorientation of mitotic spindle. Arrow denotes SPB that will enter bud (Bar, 5 μm). (B) Quantified changes of Tem1p-GFP fluorescence in arbitrary units (AU; black squares) and distance from the bud neck in microns (gray triangles) for the dSPB in A. (C) Measured changes of Tem1p-GFP fluorescence in arbitrary units (AU; black squares) and distance from the bud neck in microns (gray triangles) for the mSPB from the cell in A. The line gap in distance data points correlates with images where no mSPB signal was detected; in these cases the fluorescence intensity was recorded as zero.
Figure 10.
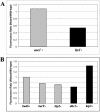
Fluorescence ratio of Tem1p-GFP accumulation on the dSPB in late anaphase cells. (A) The fluorescence intensity on the dSPB of Tem1p-GFP in _ase1_Δ or _lte1_Δ mutants was divided by the fluorescence intensity of wild-type Tem1p-GFP in late anaphase to generate a fluorescence intensity ratio. Gray bar indicates nonsignificant differences from wild-type; black bar indicates significant difference from wild-type. At least 25 individual cells were measured and averaged for each strain. (B) Tem1p-GFP fluorescence intensity ratio in spindle orientation factors and microtubule motor mutant cells. Gray bars indicate nonsignificant deviation from wild-type fluorescence intensity and black bars denote significant changes from wild-type fluorescence intensity. At least 25 individual cells were measured and averaged for each strain.
Similar articles
- The C-terminus of Bfa1p in budding yeast is essential to induce mitotic arrest in response to diverse checkpoint-activating signals.
Kim J, Jeong J, Song K. Kim J, et al. Genes Cells. 2004 May;9(5):399-418. doi: 10.1111/j.1356-9597.2004.00731.x. Genes Cells. 2004. PMID: 15147270 - Septins have a dual role in controlling mitotic exit in budding yeast.
Castillon GA, Adames NR, Rosello CH, Seidel HS, Longtine MS, Cooper JA, Heil-Chapdelaine RA. Castillon GA, et al. Curr Biol. 2003 Apr 15;13(8):654-8. doi: 10.1016/s0960-9822(03)00247-1. Curr Biol. 2003. PMID: 12699621 - The Bub2p spindle checkpoint links nuclear migration with mitotic exit.
Pereira G, Höfken T, Grindlay J, Manson C, Schiebel E. Pereira G, et al. Mol Cell. 2000 Jul;6(1):1-10. Mol Cell. 2000. PMID: 10949022 - Coupling spindle position with mitotic exit in budding yeast: The multifaceted role of the small GTPase Tem1.
Scarfone I, Piatti S. Scarfone I, et al. Small GTPases. 2015 Oct 2;6(4):196-201. doi: 10.1080/21541248.2015.1109023. Small GTPases. 2015. PMID: 26507466 Free PMC article. Review. - Mitotic exit control: a space and time odyssey.
Segal M. Segal M. Curr Biol. 2011 Oct 25;21(20):R857-9. doi: 10.1016/j.cub.2011.09.023. Curr Biol. 2011. PMID: 22032192 Review.
Cited by
- Checkpoint control of mitotic exit--do budding yeast mind the GAP?
Cooper JA, Nelson SA. Cooper JA, et al. J Cell Biol. 2006 Jan 30;172(3):331-3. doi: 10.1083/jcb.200512153. Epub 2006 Jan 23. J Cell Biol. 2006. PMID: 16431930 Free PMC article. - Mps1 phosphorylation of Dam1 couples kinetochores to microtubule plus ends at metaphase.
Shimogawa MM, Graczyk B, Gardner MK, Francis SE, White EA, Ess M, Molk JN, Ruse C, Niessen S, Yates JR 3rd, Muller EG, Bloom K, Odde DJ, Davis TN. Shimogawa MM, et al. Curr Biol. 2006 Aug 8;16(15):1489-501. doi: 10.1016/j.cub.2006.06.063. Curr Biol. 2006. PMID: 16890524 Free PMC article. - Asymmetric spindle positioning.
McCarthy EK, Goldstein B. McCarthy EK, et al. Curr Opin Cell Biol. 2006 Feb;18(1):79-85. doi: 10.1016/j.ceb.2005.12.006. Epub 2005 Dec 19. Curr Opin Cell Biol. 2006. PMID: 16361093 Free PMC article. Review. - A noncanonical GTPase signaling mechanism controls exit from mitosis in budding yeast.
Zhou X, Weng SY, Bell SP, Amon A. Zhou X, et al. bioRxiv [Preprint]. 2024 Jul 4:2024.05.16.594582. doi: 10.1101/2024.05.16.594582. bioRxiv. 2024. PMID: 38798491 Free PMC article. Updated. Preprint. - Nuclear congression is driven by cytoplasmic microtubule plus end interactions in S. cerevisiae.
Molk JN, Salmon ED, Bloom K. Molk JN, et al. J Cell Biol. 2006 Jan 2;172(1):27-39. doi: 10.1083/jcb.200510032. Epub 2005 Dec 27. J Cell Biol. 2006. PMID: 16380440 Free PMC article.
References
- Bardin, A.J., and Amon, A. (2001). Men and sin: what's the difference? Nat. Rev. Mol. Cell. Biol. 2, 815-826. - PubMed
- Bardin, A.J., Visintin, R., and Amon, A. (2000). A mechanism for coupling exit from mitosis to partitioning of the nucleus. Cell 102, 21-31. - PubMed
Publication types
MeSH terms
Substances
Grants and funding
- GM-24364/GM/NIGMS NIH HHS/United States
- GM61345-01/GM/NIGMS NIH HHS/United States
- R01 GM032238/GM/NIGMS NIH HHS/United States
- R37 GM061345/GM/NIGMS NIH HHS/United States
- GM-32238/GM/NIGMS NIH HHS/United States
- R37 GM032238/GM/NIGMS NIH HHS/United States
- R37 GM024364/GM/NIGMS NIH HHS/United States
- R01 GM024364/GM/NIGMS NIH HHS/United States
- R01 GM061345/GM/NIGMS NIH HHS/United States
LinkOut - more resources
Full Text Sources
Molecular Biology Databases
Miscellaneous

