T cell repertoire scanning is promoted by dynamic dendritic cell behavior and random T cell motility in the lymph node - PubMed (original) (raw)
T cell repertoire scanning is promoted by dynamic dendritic cell behavior and random T cell motility in the lymph node
Mark J Miller et al. Proc Natl Acad Sci U S A. 2004.
Abstract
Dendritic cells (DCs) ingest antigens in peripheral tissues and migrate to lymph nodes where they present MHC class II-bound antigen to CD4(+) T cells. We used two-photon microscopy to image the single-cell dynamics of interactions between DCs and T cells within intact lymph nodes in the absence of relevant antigen. DCs were fluorescently labeled in vivo by cutaneous injection of alum adjuvant including carboxyfluorescein diacetate succinimidyl ester (CFSE). CFSE-positive DCs (CD11c(+), CD11b(+), and low-to-intermediate CD8(+)) were observed in draining lymph nodes 24-72 h later. Labeled DCs meandered slowly (2-3 microm x min(-1)) in the T cell zone near B cell follicles but vigorously extended long agile dendrites. Encounters between T cells and DCs arose as T cells moved autonomously along random paths. Moreover, T cells did not accumulate around DCs, and their relative velocities approaching and departing DCs were equivalent, implying that T cells are not attracted toward DCs by chemotactic gradients but rather encounter them by chance. T cell/DC contacts occurred primarily on dendrites at arm's length from the DC soma and typically lasted approximately 3 min, enabling an individual DC to interact with up to 5000 T cells per hour. We conclude that dynamic DC gesticulation and random T cell motility together enhance the stochastic scanning of the T cell repertoire, thereby enabling rapid initiation of the immune response.
Figures
Fig. 1.
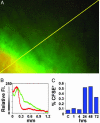
CFSE labeling at the depot and subsequent trafficking of labeled cells to draining lymph nodes. (A) Imaging the alum depot 1.5 h after intradermal ear injection of adjuvant mixture containing CFSE and fluorescent Ova. Yellow scan line represents 1.26 mm. (B) Distribution of CFSE (green) and fluorescent Ova (red) along the line-scan near the edge of the adjuvant depot in skin. (C) The kinetics of CFSE+ cell trafficking to the lymph node. Draining cervical lymph nodes were harvested at varying times after adjuvant/CFSE injection and evaluated for CFSE+ cells by flow cytometry.
Fig. 2.
Characterization and localization of _in vivo_-labeled DCs in draining lymph nodes. (A) Surface expression of CD11c, CD11b, and CD8a on CFSE+ cells. CD8a staining was on average 4-fold lower than on CD8+ T cells. (B) Fluorescence-activated cell sorter analysis of cells isolated from lymph node 24 h after injection of adjuvant containing CFSE and fluorescent Ova. (Upper) Shown is the rare population (≈0.4% of total cells) that contains both CFSE and fluorescent Ova. (Lower) Histogram showing the percentage of CFSE+ cells that contain fluorescent Ova. (C) Two-photon image of a DC in a draining lymph node showing ingested fluorescent Ova (arrow) 24 h after injection of adjuvant containing CFSE and fluorescent Ova. (Bar = 15 μm.) (D) Image showing localization of CFSE+ DC in the T cell zone (TZ) near a B cell follicle (BF) in top (left) and side (right) views. (Bar = 50 μm.) Dotted line indicates approximate follicle boundary.
Fig. 3.
Dynamics of DC movement. (A) High-resolution monochrome and depth-encoded _z_-projections of a DC, illustrating elaborate dendrite morphology shown at indicated times (min:sec); note rapid changes in dendritic morphology (see also Movie 1). (Insets) Shown are enlarged views of a selected region. (Bar = 25 μm.) Arrowheads mark individual dendrites. (B) Histogram of instantaneous DC velocities (mean = 2.7 μm·min–1) derived by tracking the center of fluorescence of 15 DCs. (C) Tracks of 15 DCs in the x, y plane normalized to their starting positions. (D) Superimposed images of a single DC, depth-encoded, to illustrate the swept volume over a 12-min period.
Fig. 4.
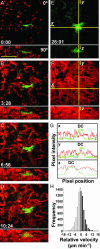
T cells approach DCs along random trajectories. (A–D) Cumulative fluorescence images of T cells (red) and DC (green) at indicated times during recording (min:sec). (Bar = 50 μm.) Frames present top (Upper) and side (Lower) views as maximum intensity projections of each orthogonal view across sequential time-lapse sequences (see also Movie 2). (E and F) Color separation of frames to illustrate the area covered by the DC (green) and the even dispersion of T cell tracks (red). (G) Profiles of green and red fluorescence intensity along the x, y, and z axes, marked by crosshairs in E and F showing that T cell density (red trace) does not increase near the DC (green trace). (H) Histogram of T cell velocities (n = 8,700) along vectors normal to DCs, showing an equal distribution of negative and positive velocities.
Fig. 5.
T cell/DC contact morphology and duration. (A) Time-lapse image sequence (times indicated min:sec) illustrating brief contacts between T cells and a DC in the absence of antigen. (Bar = 25 μm.) Top frames are true color (red, T cells; green, DC) projections along the z axis. Frames below are depth-encoded enlarged views of the same images (see also Movie 3). Multiple discrete contacts are indicated (arrows) where the DCs (green) and T cells (red) colocalize in the x-y plane and occupy the same _z_-position (display the same color) as seen in the pseudocolored image. (B) Contacts between T cells and DCs, rendered in three dimensions (see Movies 4 and 5). Contacts between T cells and DC were dynamic, changing rapidly in size over tens of seconds. Detailed morphometric analysis of several contacts: The average surface area in the contact region was 7.8 μm2 (SE = 2.0, n = 32), ranging from more than one-half (>70 μm2) of the T cell's total surface to as little as 1 μm2. Contacts took place an average of 16.8 μm (SE = 1.1 μm, n = 26) from the DC center of mass. (C) Histogram of T cell/DC contact durations (89 contacts: median duration = 3.4 min).
Similar articles
- Lung CD103+ dendritic cells efficiently transport influenza virus to the lymph node and load viral antigen onto MHC class I for presentation to CD8 T cells.
Ho AW, Prabhu N, Betts RJ, Ge MQ, Dai X, Hutchinson PE, Lew FC, Wong KL, Hanson BJ, Macary PA, Kemeny DM. Ho AW, et al. J Immunol. 2011 Dec 1;187(11):6011-21. doi: 10.4049/jimmunol.1100987. Epub 2011 Oct 31. J Immunol. 2011. PMID: 22043017 - Myoinjury transiently activates muscle antigen-specific CD8+ T cells in lymph nodes in a mouse model.
Liao H, Franck E, Fréret M, Adriouch S, Baba-Amer Y, Authier FJ, Boyer O, Gherardi RK. Liao H, et al. Arthritis Rheum. 2012 Oct;64(10):3441-51. doi: 10.1002/art.34551. Arthritis Rheum. 2012. PMID: 22674045 - Imaging the single cell dynamics of CD4+ T cell activation by dendritic cells in lymph nodes.
Miller MJ, Safrina O, Parker I, Cahalan MD. Miller MJ, et al. J Exp Med. 2004 Oct 4;200(7):847-56. doi: 10.1084/jem.20041236. J Exp Med. 2004. PMID: 15466619 Free PMC article. - Close encounters of the first and second kind: T-DC and T-B interactions in the lymph node.
Cahalan MD, Parker I. Cahalan MD, et al. Semin Immunol. 2005 Dec;17(6):442-51. doi: 10.1016/j.smim.2005.09.001. Epub 2005 Nov 2. Semin Immunol. 2005. PMID: 16263308 Free PMC article. Review. - Perfluoro-15-crown-5 ether-labeled dendritic cells.
Zhang H. Zhang H. 2008 Aug 1 [updated 2008 Sep 3]. In: Molecular Imaging and Contrast Agent Database (MICAD) [Internet]. Bethesda (MD): National Center for Biotechnology Information (US); 2004–2013. 2008 Aug 1 [updated 2008 Sep 3]. In: Molecular Imaging and Contrast Agent Database (MICAD) [Internet]. Bethesda (MD): National Center for Biotechnology Information (US); 2004–2013. PMID: 20641395 Free Books & Documents. Review.
Cited by
- Dendritic cells enhance the antigen sensitivity of T cells.
Garbi N, Kreutzberg T. Garbi N, et al. Front Immunol. 2012 Dec 26;3:389. doi: 10.3389/fimmu.2012.00389. eCollection 2012. Front Immunol. 2012. PMID: 23272004 Free PMC article. - Immune control of HIV-1 infection after therapy interruption: immediate versus deferred antiretroviral therapy.
Paci P, Carello R, Bernaschi M, D'Offizi G, Castiglione F. Paci P, et al. BMC Infect Dis. 2009 Oct 19;9:172. doi: 10.1186/1471-2334-9-172. BMC Infect Dis. 2009. PMID: 19840392 Free PMC article. - An extended vision for dynamic high-resolution intravital immune imaging.
Germain RN, Castellino F, Chieppa M, Egen JG, Huang AY, Koo LY, Qi H. Germain RN, et al. Semin Immunol. 2005 Dec;17(6):431-41. doi: 10.1016/j.smim.2005.09.003. Epub 2005 Oct 10. Semin Immunol. 2005. PMID: 16216522 Free PMC article. Review. - Live imaging of effector cell trafficking and autoantigen recognition within the unfolding autoimmune encephalomyelitis lesion.
Kawakami N, Nägerl UV, Odoardi F, Bonhoeffer T, Wekerle H, Flügel A. Kawakami N, et al. J Exp Med. 2005 Jun 6;201(11):1805-14. doi: 10.1084/jem.20050011. J Exp Med. 2005. PMID: 15939794 Free PMC article. - The Chemokine Receptor CCR7 Uses Distinct Signaling Modules With Biased Functionality to Regulate Dendritic Cells.
Rodríguez-Fernández JL, Criado-García O. Rodríguez-Fernández JL, et al. Front Immunol. 2020 Apr 15;11:528. doi: 10.3389/fimmu.2020.00528. eCollection 2020. Front Immunol. 2020. PMID: 32351499 Free PMC article. Review.
References
- Demotz, S., Grey, H. M. & Sette, A. (1990) Science 249, 1028–1030. - PubMed
- Harding, C. V. & Unanue, E. R. (1990) Nature 346, 574–576. - PubMed
- Irvine, D. J., Purbhoo, M. A., Krogsgaard, M. & Davis, M. M. (2002) Nature 419, 845–849. - PubMed
- von Andrian, U. H. & Mackay, C. R. (2000) N. Engl. J. Med. 343, 1020–1034. - PubMed
Publication types
MeSH terms
Grants and funding
- GM-41514/GM/NIGMS NIH HHS/United States
- R01 GM048071/GM/NIGMS NIH HHS/United States
- R37 GM048071/GM/NIGMS NIH HHS/United States
- GM-48071/GM/NIGMS NIH HHS/United States
- R01 GM041514/GM/NIGMS NIH HHS/United States
LinkOut - more resources
Full Text Sources
Other Literature Sources
Research Materials
Miscellaneous


