The transition from development to motor control function in the corticospinal system - PubMed (original) (raw)
The transition from development to motor control function in the corticospinal system
Zhuo Meng et al. J Neurosci. 2004.
Abstract
During early postnatal development, corticospinal (CS) system stimulation, electrical or transcranial magnetic, is minimally effective in producing muscle contraction, despite having axon terminals that excite spinal neurons. Later, after stimulation becomes more effective, the cortical motor representation develops, and movements the system controls in maturity are expressed. We determined whether development of temporal facilitation (response enhancement produced by the second of a pair of pyramidal tract stimuli, or a higher stimulus multiple of a train of stimuli) correlated with these changes. Facilitation of the monosynaptic CS response was larger in older kittens and adults than younger kittens. When facilitation was strong, strong motor responses were evoked by pyramidal stimulation with small currents and few pulses. With strong facilitation in older kittens, corticospinal axon varicosities colocalize synaptophysin like adults, suggesting a presynaptic mechanism. With effective facilitation, control signals from the cortex can be sufficiently effective to provoke muscle contraction for guiding movements.
Figures
Figure 1.
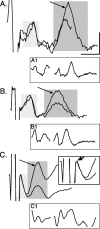
Facilitation of CS postsynaptic responses. Ensemble averages (n = 10 stimuli) of surface recordings (at C6) in response to a pair of PT stimuli (twice threshold) at PW4 (A), PW7 (B), and in an adult (C). Averages for the potentials evoked by the first stimulus were synchronized with the first stimulus artifact, and potentials evoked by the second stimulus were synchronized by the second artifact. Traces were aligned with the point of maximal value of the volley. The light gray box marks the CS volley, and the dark gray box marks postsynaptic response. Arrows point to the postsynaptic response evoked by the second stimulus, which was larger than to the first. A1, As in A, but a continuous trace with the stimulus artifacts eliminated for clarity. B1, As in B, but a continuous trace with the stimulus artifacts eliminated for clarity. C1, As in C, but a continuous trace with the stimulus artifacts eliminated for clarity. C, Inset. As in C, but expansion of the artifact and volley. The arrow in the inset points to the peak of the CS volley. Most of the early phase of the potential was obscured by the stimulus artifact. Calibration: A, 0.5 msec, 5.1 μV; B, 0.5 msec, 8 μV; C, 0.5 msec, 9.36 μV; A1, 1.35 msec, 16.5 μV; B1, 1.35 msec; 15 μV; C1, 1.35 msec, 22.9 μV; C, inset, 0.35 msec, 11.4 μV.
Figure 4.
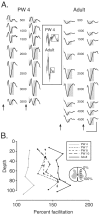
CS facilitation occurs over a wide dorsoventral extent of the spinal gray matter. A, Spinal surface and depth recordings in a PW4 animal (left) and adult (right). Ensemble averages (n = 10; across the 10 rostrocaudal penetration sites) are shown in relation to the spinal schematic section (in the bottom). The artifacts were eliminated for clarity. For each animal, the panel on the left shows responses to the first stimulus, and the panel on the right shows responses to the second stimulus. For the top trace (500 μm), the light gray boxes correspond to the presynaptic field potential, and the dark gray box correspond to the postsynaptic field potential. Arrows mark the onsets of each stimulus. The inset shows overlay plots of the surface volleys (boxed) recorded during stimulation. Black lines plot responses to the first stimulus, and gray lines plot responses to the second stimulus. B, Relationship between postsynaptic response amplitude and depth, expressed as the percentage of gray matter from the dorsal border. Calibration: PW4, 1 msec, 100 μV; adult, 1 msec, 750 μV.
Figure 2.
Facilitation of the postsynaptic responses. Each gray bar in the graph plots mean ± SE percentage facilitation for the postsynaptic response for various age groups. Open bars plot mean ± SE percentage facilitation for the volley. Asterisks indicate significant differences. Each bar is the average of data from multiple animals (less than PW5 = 4; PW7-PW13 = 6; adult = 4).
Figure 3.
Effect of interstimulus interval on CS facilitation. The vertical gray bar marks the principal interstimulus interval used (3.33 msec). Each data point in C is the average of data from several animals (less than PW5 = 4; PW7-PW13 = 6; adult = 4).
Figure 5.
Potentials recorded from the musculocutaneous nerve in response to PT stimulation. A, Recordings from a PW4 animal. Arrows correspond to the time of occurrence of each stimulus. Ensemble averages show the effects of multiple stimuli using the amount of current indicated. B, As in A, but for an adult. B, Inset, Section of the dorsal roots from C4 to T1 has no effect on the recorded nerve potential. Ensemble average was from an adult, in response to five stimuli at 200 μA. Calibration: A, 500 μV; B, 300 μV; B, inset, 10 msec, 50 μV.
Figure 6.
Current amplitude-stimulus number plots for animals of different ages. A, Images plot the amount of rectified and integrated nerve activity that was evoked for a particular current amplitude and number of stimuli. The black portion of the plots are points at which no stimulus was given because this was in the region of the stimulus current-stimulus number space producing maximal responses. B, Contours (at 40% maximal) were fitted to the data values in the graphs in A, as well as for two additional animals. The thick lines covering part of each contour is the location of the threshold boundary (i.e., responses evoked by the lowest current amplitudes and fewest numbers of stimuli).
Figure 7.
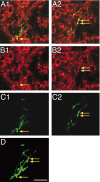
Synaptophysin labeling within labeled mature CS axon terminal varicosities. A, Merged images of BDA and synaptophysin label for two optical planes (A1, A2). B, Synaptophysin labeling only. C, BDA labeling only. D, The projection image for this axon terminal. Arrows mark the locations of varicosities, all of which are double labeled. Scale bar, 50 μm.
Figure 8.
Synaptophysin labeling within labeled immature CS axon terminal varicosities Similar to Figure 7, but for a typical CS terminal at PW4. Arrows mark the locations of varicosities (yellow, double labeled; white, BDA label only). Scale bar, 25 μm.
Similar articles
- Presynaptic control of transmission through group II muscle afferents in the midlumbar and sacral segments of the spinal cord is independent of corticospinal control.
Aggelopoulos NC, Chakrabarty S, Edgley SA. Aggelopoulos NC, et al. Exp Brain Res. 2008 May;187(1):61-70. doi: 10.1007/s00221-008-1279-y. Epub 2008 Jan 30. Exp Brain Res. 2008. PMID: 18231783 Free PMC article. - Reduced intracortical inhibition and facilitation of corticospinal neurons in musicians.
Nordstrom MA, Butler SL. Nordstrom MA, et al. Exp Brain Res. 2002 Jun;144(3):336-42. doi: 10.1007/s00221-002-1051-7. Epub 2002 Apr 13. Exp Brain Res. 2002. PMID: 12021815 - Postnatal development of connectional specificity of corticospinal terminals in the cat.
Li Q, Martin JH. Li Q, et al. J Comp Neurol. 2002 May 20;447(1):57-71. doi: 10.1002/cne.10203. J Comp Neurol. 2002. PMID: 11967895 - Activity- and use-dependent plasticity of the developing corticospinal system.
Martin JH, Friel KM, Salimi I, Chakrabarty S. Martin JH, et al. Neurosci Biobehav Rev. 2007;31(8):1125-35. doi: 10.1016/j.neubiorev.2007.04.017. Epub 2007 May 17. Neurosci Biobehav Rev. 2007. PMID: 17599407 Free PMC article. Review. - Physiological basis of motor effects of a transient stimulus to cerebral cortex.
Amassian VE, Stewart M, Quirk GJ, Rosenthal JL. Amassian VE, et al. Neurosurgery. 1987 Jan;20(1):74-93. Neurosurgery. 1987. PMID: 3543727 Review.
Cited by
- Thalamic POm projections to the dorsolateral striatum of rats: potential pathway for mediating stimulus-response associations for sensorimotor habits.
Smith JB, Mowery TM, Alloway KD. Smith JB, et al. J Neurophysiol. 2012 Jul;108(1):160-74. doi: 10.1152/jn.00142.2012. Epub 2012 Apr 11. J Neurophysiol. 2012. PMID: 22496533 Free PMC article. - Postnatal refinement of proprioceptive afferents in the cat cervical spinal cord.
Chakrabarty S, Martin J. Chakrabarty S, et al. Eur J Neurosci. 2011 May;33(9):1656-66. doi: 10.1111/j.1460-9568.2011.07662.x. Epub 2011 Apr 19. Eur J Neurosci. 2011. PMID: 21501251 Free PMC article. - Pyramidal tract stimulation restores normal corticospinal tract connections and visuomotor skill after early postnatal motor cortex activity blockade.
Salimi I, Friel KM, Martin JH. Salimi I, et al. J Neurosci. 2008 Jul 16;28(29):7426-34. doi: 10.1523/JNEUROSCI.1078-08.2008. J Neurosci. 2008. PMID: 18632946 Free PMC article. - Motor cortex maturation is associated with reductions in recurrent connectivity among functional subpopulations and increases in intrinsic excitability.
Biane JS, Scanziani M, Tuszynski MH, Conner JM. Biane JS, et al. J Neurosci. 2015 Mar 18;35(11):4719-28. doi: 10.1523/JNEUROSCI.2792-14.2015. J Neurosci. 2015. PMID: 25788688 Free PMC article. - Motor cortex and spinal cord neuromodulation promote corticospinal tract axonal outgrowth and motor recovery after cervical contusion spinal cord injury.
Zareen N, Shinozaki M, Ryan D, Alexander H, Amer A, Truong DQ, Khadka N, Sarkar A, Naeem S, Bikson M, Martin JH. Zareen N, et al. Exp Neurol. 2017 Nov;297:179-189. doi: 10.1016/j.expneurol.2017.08.004. Epub 2017 Aug 10. Exp Neurol. 2017. PMID: 28803750 Free PMC article.
References
- Ahmari SE, Smith SJ (2002) Knowing a nascent synapse when you see it. Neuron 34: 333-336. - PubMed
- Alisky JM, Swink TD, Tolbert DL (1992) The postnatal spatial and temporal development of corticospinal projections in cats. Exp Brain Res 88: 265-276. - PubMed
- Alstermark B, Ohlson S (2000) Origin of corticospinal neurones evoking disynaptic excitation in forelimb motoneurones mediated via C3-C4 propriospinal neurones in the cat. Neurosci Res 37: 91-100. - PubMed
- Baldissera F, Hultborn H, Illert M (1981) Integration in spinal neuronal systems. In: Handbook of physiology, Sec I, The nervous system, Vol II, Motor Control (Brooks VB, ed), pp 509-596. Bethesda: American Physiological Society.
Publication types
MeSH terms
Substances
LinkOut - more resources
Full Text Sources


