Statistical resynchronization and Bayesian detection of periodically expressed genes - PubMed (original) (raw)
Statistical resynchronization and Bayesian detection of periodically expressed genes
Xin Lu et al. Nucleic Acids Res. 2004.
Abstract
We propose a periodic-normal mixture (PNM) model to fit transcription profiles of periodically expressed (PE) genes in cell cycle microarray experiments. The model leads to a principled statistical estimation procedure that produces more accurate estimates of the mean cell cycle length and the gene expression periodicity than existing heuristic approaches. A central component of the proposed procedure is the resynchronization of the observed transcription profile of each PE gene according to the PNM with estimated periodicity parameters. By using a two-component mixture-Beta model to approximate the PNM fitting residuals, we employ an empirical Bayes method to detect PE genes. We estimate that about one-third of the genes in the genome of Saccharomyces cerevisiae are likely to be transcribed periodically, and identify 822 genes whose posterior probabilities of being PE are greater than 0.95. Among these 822 genes, 540 are also in the list of 800 genes detected by Spellman. Gene ontology annotation analysis shows that many of the 822 genes were involved in important cell cycle-related processes, functions and components. When matching the 822 resynchronized expression profiles of three independent experiments, little phase shifts were observed, indicating that the three synchronization methods might have brought cells to the same phase at the time of release.
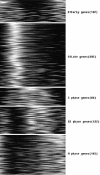
Figures
Figure 1
Transcription profiles of five typical groups of stage-specific genes. Solid lines represent the transcription profiles of stage-specific genes. The line of asterisks represents the average transcription profile of the genes within each group.
Figure 2
The periodic–normal mixture model fitting of the CLN2 profiles in the three data sets: cdc28, cdc15 and alpha. Columns 1–3, transcription profile fitted with one, two and three sinusoids; column 4, the PNM fitting (K = 3 with normal mixture) to real observations. Solid curves are the PNM model and the asterisks are observations.
Figure 3
The PNM model fittings of four periodically expressed genes in the three data sets: cdc28, cdc15 and alpha. Solid curves denote the PNM model and the asterisks denote observations.
Figure 4
Histograms of model fitting residual sum of squares of the three data sets (cdc28, cdc15 and alpha) overlaid with the fitted mixture-Beta distributions.
Figure 5
Clustering of the 822 PNM-identified periodic transcripts into the five stage-specific groups.
Similar articles
- Detecting biological associations between genes based on the theory of phase synchronization.
Kim CS, Riikonen P, Salakoski T. Kim CS, et al. Biosystems. 2008 May;92(2):99-113. doi: 10.1016/j.biosystems.2007.12.006. Epub 2008 Jan 11. Biosystems. 2008. PMID: 18289772 - Bayesian detection of periodic mRNA time profiles without use of training examples.
Andersson CR, Isaksson A, Gustafsson MG. Andersson CR, et al. BMC Bioinformatics. 2006 Feb 9;7:63. doi: 10.1186/1471-2105-7-63. BMC Bioinformatics. 2006. PMID: 16469110 Free PMC article. - Identifying periodically expressed transcripts in microarray time series data.
Wichert S, Fokianos K, Strimmer K. Wichert S, et al. Bioinformatics. 2004 Jan 1;20(1):5-20. doi: 10.1093/bioinformatics/btg364. Bioinformatics. 2004. PMID: 14693803 - SCEPTRANS: an online tool for analyzing periodic transcription in yeast.
Kudlicki A, Rowicka M, Otwinowski Z. Kudlicki A, et al. Bioinformatics. 2007 Jun 15;23(12):1559-61. doi: 10.1093/bioinformatics/btm126. Epub 2007 Mar 30. Bioinformatics. 2007. PMID: 17400726 - Periodic transcription: a cycle within a cycle.
Breeden LL. Breeden LL. Curr Biol. 2003 Jan 8;13(1):R31-8. doi: 10.1016/s0960-9822(02)01386-6. Curr Biol. 2003. PMID: 12526763 Review.
Cited by
- Periodic mRNA synthesis and degradation co-operate during cell cycle gene expression.
Eser P, Demel C, Maier KC, Schwalb B, Pirkl N, Martin DE, Cramer P, Tresch A. Eser P, et al. Mol Syst Biol. 2014 Jan 30;10(1):717. doi: 10.1002/msb.134886. Print 2014. Mol Syst Biol. 2014. PMID: 24489117 Free PMC article. - Studying and modelling dynamic biological processes using time-series gene expression data.
Bar-Joseph Z, Gitter A, Simon I. Bar-Joseph Z, et al. Nat Rev Genet. 2012 Jul 18;13(8):552-64. doi: 10.1038/nrg3244. Nat Rev Genet. 2012. PMID: 22805708 Review. - Principal-oscillation-pattern analysis of gene expression.
Wang D, Arapostathis A, Wilke CO, Markey MK. Wang D, et al. PLoS One. 2012;7(1):e28805. doi: 10.1371/journal.pone.0028805. Epub 2012 Jan 10. PLoS One. 2012. PMID: 22253697 Free PMC article. - Time-course analysis of cyanobacterium transcriptome: detecting oscillatory genes.
Layana C, Diambra L. Layana C, et al. PLoS One. 2011;6(10):e26291. doi: 10.1371/journal.pone.0026291. Epub 2011 Oct 18. PLoS One. 2011. PMID: 22028849 Free PMC article. - A branching process model for flow cytometry and budding index measurements in cell synchrony experiments.
Orlando DA, Iversen ES Jr, Hartemink AJ, Haase SB. Orlando DA, et al. Ann Appl Stat. 2009 Winter;3(4):1521-1541. doi: 10.1214/09-AOAS264. Ann Appl Stat. 2009. PMID: 21853014 Free PMC article.
References
- Cho R.J., Campbell,M.J., Winzeler,E.A., Steinmetz,L., Conway,A., Wodicka,L., Wolfsberg,T.G., Gabrielian,A.E., Landsman,D., Lockhart,D.J. et al. (1998) A genome-wide transcriptional analysis of the mitotic cell cycle. Mol. Cell, 2, 65–73. - PubMed
- Tavazoie S., Hughes,J.D., Campbell,M.J., Cho,R.J. and Church,G.M. (1999) Systematic determination of genetic network architecture. Nature Genet., 22, 281–285. - PubMed
Publication types
MeSH terms
LinkOut - more resources
Full Text Sources
Molecular Biology Databases


