Apoptosis of insulin-secreting cells induced by endoplasmic reticulum stress is amplified by overexpression of group VIA calcium-independent phospholipase A2 (iPLA2 beta) and suppressed by inhibition of iPLA2 beta - PubMed (original) (raw)
Apoptosis of insulin-secreting cells induced by endoplasmic reticulum stress is amplified by overexpression of group VIA calcium-independent phospholipase A2 (iPLA2 beta) and suppressed by inhibition of iPLA2 beta
Sasanka Ramanadham et al. Biochemistry. 2004.
Abstract
The death of insulin-secreting beta-cells that causes type I diabetes mellitus (DM) occurs in part by apoptosis, and apoptosis also contributes to progressive beta-cell dysfunction in type II DM. Recent reports indicate that ER stress-induced apoptosis contributes to beta-cell loss in diabetes. Agents that deplete ER calcium levels induce beta-cell apoptosis by a process that is independent of increases in [Ca(2+)](i). Here we report that the SERCA inhibitor thapsigargin induces apoptosis in INS-1 insulinoma cells and that this is inhibited by a bromoenol lactone (BEL) inhibitor of group VIA calcium-independent phospholipase A(2) (iPLA(2)beta). Overexpression of iPLA(2)beta amplifies thapsigargin-induced apoptosis of INS-1 cells, and this is also suppressed by BEL. The magnitude of thapsigargin-induced INS-1 cell apoptosis correlates with the level of iPLA(2)beta expression in various cell lines, and apoptosis is associated with stimulation of iPLA(2)beta activity, perinuclear accumulation of iPLA(2)beta protein and activity, and caspase-3-catalyzed cleavage of full-length 84 kDa iPLA(2)beta to a 62 kDa product that associates with nuclei. Thapsigargin also induces ceramide accumulation in INS-1 cells, and this response is amplified in cells that overexpress iPLA(2)beta. These findings indicate that iPLA(2)beta participates in ER stress-induced apoptosis, a pathway that promotes beta-cell death in diabetes.
Figures
Figure 1
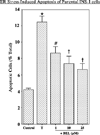
ER stress-induced apoptosis in parental INS-1 cells and effects of BEL inhibition. Parental INS-1 cells were treated with either vehicle (DMSO) alone (Control) or 1 /µM thapsigargin (T) in the absence and presence of 1, 10, or 25 /µM BEL. After 24 h, the cells were harvested for TUNEL analyses. The data representing the percentage of apoptotic cells, relative to the total number of cells, are illustrated as the mean ± SEM (n = 5). The asterisk denotes that the thapsigargin-treated group is significantly different from the control group (p < 0.01). The pound sign denotes that the BEL-treated group is significantly different from the T and Control groups (p < 0.01). The daggers denote that the BEL-treated group is significantly different from the T group (p < 0.05).
Figure 2
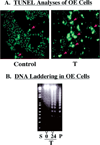
ER stress-induced apoptosis of iPLA2β-overexpressing INS-1 cells. Stably transfected INS-1 cells that overexpress iPLA2β (OE) were treated with vehicle alone (Control) or with thapsigargin (T, 1 /µM). After 24 h, the cells were harvested for TUNEL and DNA laddering analyses to determine the fraction of the cell population undergoing apoptosis. (A) The brightly fluorescent cells, denoted with red arrows, reflect apoptotic cells. (B) The lanes marked 0 and 24 contain DNA from OE cells that were treated with thapsigargin for 0 and 24 h, respectively. Lane S contained the standard kilobase ladder, and lane P contained the standard positive sample of DNA from U937 cells provided by the manufacturer.
Figure 3
Effects of iPLA2β inhibition on ER stress-induced apoptosis in stably transfected INS-1 cells that overexpress iPLA2β. (A) Stably transfected INS-1 cells that overexpress iPLA2β (OE cells) or cells that were transfected with the empty retroviral vector (V cells) that contained no iPLA2β cDNA were treated with vehicle alone (Con) or with thapsigargin (T, 1 µM). After 24 h, the fraction of apoptotic cells was determined with a TUNEL assay. The asterisk denotes that T-treated V cells are significantly different from the corresponding Con group and the pound sign that T-treated OE cells are significantly different from all groups (p < 0.05). (B) OE cells were cultured with vehicle alone (Con) or with thapsigargin (T, 1 µM) in the absence and presence of BEL (1 µM). The asterisk denotes that the T-treated group is significantly different from the Con groups (p < 0.05) and the pound sign that the T- and BEL-treated group is significantly different from other groups (p < 0.05). The data representing the percentage of apoptotic cells, relative to the total number of cells, are illustrated as the mean ± SEM (n = 19).
Figure 4
Relationship between iPLA2β activity and ER stress-induced INS-1 cell apoptosis. Five distinct INS-1 cell lines that overexpressed varied levels of iPLA2β activity were treated with thapsigargin (1 µM). After 24 h, the cells were harvested and processed for iPLA2β activity and TUNEL analyses. The data representing the specific iPLA2β enzymatic activity and the percentage of apoptotic cells, relative to the total number of cells, are illustrated as the mean ± SEM (n = 6). The inset shows iPLA2β immunoblotting analyses in 30 µg protein aliquots of homogenates prepared from the five INS-1 cell lines.
Figure 5
ER stress-induced changes in the subcellular distribution of iPLA2β activity. (A) Aliquots (containing 30 µg of protein) of cytosol and resuspended membranes prepared from OE cells, as described previously (35), were assayed for iPLA2β activity at various times following treatment with thapsigargin (1 µM). The data are presented as the mean ± SEM (n = 19). The asterisk denotes that the thapsigargin-treated group is significantly different from the 0 h group (p < 0.05). (B) The nuclear fraction was prepared, as described previously (33), from OE cells treated with thapsigargin for various intervals. The data are presented as the mean ± SEM (n = 19) of the percent change in enzymatic activity following thapsigargin treatment, relative to 0 h values. The asterisk denotes that the thapsigargin-treated group is significantly different from the 0 h group (p < 0.05).
Figure 6
Changes in the subcellular distribution of iPLA2β-immunoreactive protein after induction of ER stress in INS-1 cells. (A) Cells seeded in glass-chambered slides were cultured in the presence of a vehicle alone or thapsigargin (T, 1 µM) for 24 h and then processed for immunocytofluorescence analyses. Fixed, permeabilized cells were probed with polyclonal iPLA2β antibodies followed by visualization of Cy3 fluorescence. (B) Aliquots of the INS-1 cell nuclear protein (50 µg) prepared from OE cells treated with thapsigargin (1 µM) were analyzed by SDS—PAGE (7.5%) and transferred onto Immobilon-P PVDF membranes. The electroblot was probed with iPLA2β antibodies, and immunoreactive protein bands were visualized by enhanced chemiluminescence (ECL): vehicle-treated controls (C) and thapsigargin-treated cells (T).
Figure 7
Characterization of the interaction of iPLA2β-immunoreactive proteins with the iPLA2β antibody preparation. (A) iPLA2β protein schema. Illustration of peptide antigen sequences in iPLA2β against which antibodies were generated and location of the consensus sequence for caspase-3 cleavage. (B) Effects of caspase-3 inhibition on the generation of the 62 kDa iPLA2β-immunoreactive protein postulated to arise from caspase-3 cleavage. The presence of the iPLA2/3-immunoreactive protein was examined in cytosol prepared from cells in the absence (lanes 1 and 3) or presence (lane 2) of a caspase-3 inhibitor (C3-I). Following SDS–PAGE analyses, the proteins were transferred to membranes for immunoblotting studies with the polyclonal iPLA2β antibody preparation in the absence (lanes 1 and 2) or presence of antigen peptide 2. (C) Fluorescence microscopy was used to visualize iPLA2β immunocytofluorescence in INS-1 cells probed with iPLA2β0 antibodies in the absence and presence of neutralizing peptide antigens: (a) iPLA2β antibodies alone, (b) iPLA2β antibodies with peptide 2, (c) iPLA2β antibodies with peptide 1, and (d) iPLA2β antibodies with peptides 1 and 2.
Figure 8
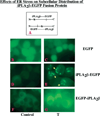
Effects of ER stress on the subcellular distribution of an iPLA2β-EGFP fusion protein in INS-1 cells. (A) Schematic of two fusion protein constructs where X indicates the potential caspase-3 cleavage site in the iPLA2β protein. INS-1 cells were transfected with either EGFP vector alone (panels B and C) or constructs designed to attach the EGFP tag to the N-terminus (EGFP-iPLA2β, panels D and E) or the C-terminus (iPLA2β-EGFP, panels F and G) of iPLA2β. Cells were treated with vehicle only (Control, panels BD, and F) or with 1 µM thapsigargin (T, panels CE, and G) and examined by fluorescence microscopy 6 h later. The iPLA2β-EGFP-producing INS-1 cells treated with thapsigargin exhibit punctate perinuclear iPLA2β fluorescence, as indicated with yellow arrows (panel E).
Figure 9
Effects of caspase-3 inhibition on the subcellular redistribution of iPLA2β immunocytofluorescence in INS-1 cells subjected to ER stress. OE cells were pretreated with vehicle alone or with caspase-3 inhibitor (C3-I, 500 nM) for 24 h. The vehicle-pretreated cells were then treated with vehicle alone (Control) or with 1 /µM thapsigargin (T) alone, and the C3-I-pretreated cells were treated with C3-I alone (C3-I) or with T (T + C3-I). After an additional 24 h, the cells were processed for iPLA2β immunocytofluorescence analyses by fluorescence microscopy. The data are representative of findings obtained from three separate experiments.
Figure 10
Effects of inhibition of caspase-3 on inhibition of ER stress-induced apoptosis of INS-1 cells. OE cells were pretreated with vehicle alone or with 500 nM C3-I for 24 h. The vehicle-pretreated cells were then treated with vehicle alone (Control) or with 1 µM thapsigargin (T) alone, and the C3-I-pretreated cells were treated with either C3-I alone (C3-I) or T (T + C3-I). After 24 h, cells were harvested and TUNEL analyses performed. The data representing the percentage of apoptotic cells, relative to the total number of cells, are illustrated as the mean± (SEM (n =10). The asterisk denotes that the T group is significantly different from Control and C3-I groups and the pound sign that the T + C3-I group is significantly different from other groups (p < 0.05).
Figure 11
Electrospray ionization (ESI) mass spectrometric analyses of ceramide species from INS-1 cells as Li+ adducts. Ceramides were extracted from INS-1 cells and analyzed by ESI/MS as Li+ adducts. (A) Positive ion ESI/MS total ion current (TIC). (B) ESI/MS tandem spectrum obtained from collisionally activated dissociation (CAD) of m/z 654 (C24:1–CM-Li+). (C) ESI/MS tandem spectrum obtained from CAD of m/z 544 (C16:0–CM-Li+). (D) Rationalization of the ceramide (24:1-CM) fragmentation pattern. R is the fatty acid substituent side chain.
Figure 12
ER stress-induced ceramide accumulation in INS-1 cells. Ceramides extracted from OE cells incubated for 24 h with vehicle alone (A) or with thapsigargin (B) were analyzed as Li+ adducts by ESI/MS/MS scanning for a constant neutral loss of 48.
Figure 13
Time-course of ER stress-induced ceramide accumulation in INS-1 cells and effects of iPLA2β overexpression. The ceramide (CM) content was measured by ESI/MS/MS in lipids extracted from INS-1 cells transfected with the empty vector (V cells) or stably transfected INS-1 cells that overexpress iP_LA2/3_ (OE cells) treated for various periods with thapsigargin (1 µM). The CM content was normalized to the total lipid phosphorus content and expressed as the ratio to the normalized CM content of the time zero value. (A) Change in content with time after exposure to thapsigargin for individual CM molecular species. (B) Time course of accumulation of the sum of all CM species. The asterisks denote that thapsigargin-treated OE-cell groups are significantly different from the corresponding 0 h OE group (p < 0.01). The dagger denotes that the V cell group at 24 h is significantly different from the corresponding 0 h V cell group and OE group at 24 h (p < 0.05). The pound signs denote that the V cell groups at 6 and 16 h are significantly different from the corresponding OE groups (p < 0.05).
Similar articles
- Pancreatic islets and insulinoma cells express a novel isoform of group VIA phospholipase A2 (iPLA2 beta) that participates in glucose-stimulated insulin secretion and is not produced by alternate splicing of the iPLA2 beta transcript.
Ramanadham S, Song H, Hsu FF, Zhang S, Crankshaw M, Grant GA, Newgard CB, Bao S, Ma Z, Turk J. Ramanadham S, et al. Biochemistry. 2003 Dec 2;42(47):13929-40. doi: 10.1021/bi034843p. Biochemistry. 2003. PMID: 14636061 Free PMC article. - A link between endoplasmic reticulum stress-induced β-cell apoptosis and the group VIA Ca2+-independent phospholipase A2 (iPLA2β).
Lei X, Zhang S, Emani B, Barbour SE, Ramanadham S. Lei X, et al. Diabetes Obes Metab. 2010 Oct;12 Suppl 2(0 2):93-8. doi: 10.1111/j.1463-1326.2010.01270.x. Diabetes Obes Metab. 2010. PMID: 21029305 Free PMC article. Review. - Group VIA Ca2+-independent phospholipase A2 (iPLA2beta) and its role in beta-cell programmed cell death.
Lei X, Barbour SE, Ramanadham S. Lei X, et al. Biochimie. 2010 Jun;92(6):627-37. doi: 10.1016/j.biochi.2010.01.005. Epub 2010 Jan 18. Biochimie. 2010. PMID: 20083151 Free PMC article. Review.
Cited by
- Differential lipid signaling from CD4+ and CD8+ T cells contributes to type 1 diabetes development.
White TD, Almutairi A, Gai-Tusing Y, Stephenson DJ, Stephenson BD, Chalfant CE, Lei X, Lu B, Hammock BD, DiLorenzo TP, Ramanadham S. White TD, et al. Front Immunol. 2024 Sep 18;15:1444639. doi: 10.3389/fimmu.2024.1444639. eCollection 2024. Front Immunol. 2024. PMID: 39359722 Free PMC article. - Polarization of Macrophages toward M2 Phenotype Is Favored by Reduction in iPLA2β (Group VIA Phospholipase A2).
Ashley JW, Hancock WD, Nelson AJ, Bone RN, Tse HM, Wohltmann M, Turk J, Ramanadham S. Ashley JW, et al. J Biol Chem. 2016 Oct 28;291(44):23268-23281. doi: 10.1074/jbc.M116.754945. Epub 2016 Sep 20. J Biol Chem. 2016. PMID: 27650501 Free PMC article. - Roles of acidic phospholipids and nucleotides in regulating membrane binding and activity of a calcium-independent phospholipase A2 isoform.
Morrison K, Witte K, Mayers JR, Schuh AL, Audhya A. Morrison K, et al. J Biol Chem. 2012 Nov 9;287(46):38824-34. doi: 10.1074/jbc.M112.391508. Epub 2012 Sep 24. J Biol Chem. 2012. PMID: 23007400 Free PMC article. - A bromoenol lactone suicide substrate inactivates group VIA phospholipase A2 by generating a diffusible bromomethyl keto acid that alkylates cysteine thiols.
Song H, Ramanadham S, Bao S, Hsu FF, Turk J. Song H, et al. Biochemistry. 2006 Jan 24;45(3):1061-73. doi: 10.1021/bi052065q. Biochemistry. 2006. PMID: 16411783 Free PMC article. - Endoplasmic reticulum stress and atherosclerosis.
Hotamisligil GS. Hotamisligil GS. Nat Med. 2010 Apr;16(4):396-9. doi: 10.1038/nm0410-396. Nat Med. 2010. PMID: 20376052 Free PMC article.
References
- Didac M, Mandrup-Poulsen T. Diabetes. 1998;47:1537–1543. - PubMed
- Eizirik DL, Mandrup-Poulsen T. Diabetologia. 2001;44:2115–2133. - PubMed
- Tisch R, McDevitt H. Cell. 1996;85:291–297. - PubMed
- Kahn CR. Nature. 1995;373:384–385. - PubMed
- De Fronzo RA. J. Clin. InVest. 1997;5:177–269.
Publication types
MeSH terms
Substances
Grants and funding
- R37 DK034388/DK/NIDDK NIH HHS/United States
- P60-DK20579/DK/NIDDK NIH HHS/United States
- R01 DK069455/DK/NIDDK NIH HHS/United States
- P30 DK056341/DK/NIDDK NIH HHS/United States
- R37-DK34388/DK/NIDDK NIH HHS/United States
- P60 DK020579/DK/NIDDK NIH HHS/United States
- P01 HL057278/HL/NHLBI NIH HHS/United States
- P41 RR000954/RR/NCRR NIH HHS/United States
- P41-RR00954/RR/NCRR NIH HHS/United States
- P30-DK56341/DK/NIDDK NIH HHS/United States
- P01-HL57278/HL/NHLBI NIH HHS/United States
LinkOut - more resources
Full Text Sources
Other Literature Sources
Medical
Research Materials
Miscellaneous


