The Na+ channel inactivation gate is a molecular complex: a novel role of the COOH-terminal domain - PubMed (original) (raw)
Comparative Study
The Na+ channel inactivation gate is a molecular complex: a novel role of the COOH-terminal domain
Howard K Motoike et al. J Gen Physiol. 2004 Feb.
Abstract
Electrical activity in nerve, skeletal muscle, and heart requires finely tuned activity of voltage-gated Na+ channels that open and then enter a nonconducting inactivated state upon depolarization. Inactivation occurs when the gate, the cytoplasmic loop linking domains III and IV of the alpha subunit, occludes the open pore. Subtle destabilization of inactivation by mutation is causally associated with diverse human disease. Here we show for the first time that the inactivation gate is a molecular complex consisting of the III-IV loop and the COOH terminus (C-T), which is necessary to stabilize the closed gate and minimize channel reopening. When this interaction is disrupted by mutation, inactivation is destabilized allowing a small, but important, fraction of channels to reopen, conduct inward current, and delay cellular repolarization. Thus, our results demonstrate for the first time that physiologically crucial stabilization of inactivation of the Na+ channel requires complex interactions of intracellular structures and indicate a novel structural role of the C-T domain in this process.
Figures
Figure 1.
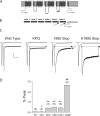
Mutation of the Na+ channel C-T domain and III-IV loop synergistically disrupts inactivation and increases Isus. (A) Membrane-spanning model of the SCN5A sodium channel indicating the COOH domain and IFM motif in the III-IV loop. (B) Expanded view indicates the six predicted α helices within the C-T and sites of the deletion mutants 1885stop and 1921stop. (C) Whole-cell currents are shown at low and high gain (insets, peak currents are off-scale) recorded in HEK 293 cells expressing SCN5A constructs. Shown are normalized and averaged TTX-sensitive current traces (
materials and methods
) in response to voltage steps (−10 mV, 150 ms) (left to right, wild-type (WT), (n = 4); ΔKPQ (n = 4); 1885stop (n = 6); and K1885 (n = 5); arrow indicates ISUS). Bars: 20 ms high and 50 ms low gain traces; 1% peak current, high gain traces. (D) Mean ± SEM Isus (calculated as the percentage of peak current) measured at 150 ms during depolarization. ** and ##, P < 0.001 vs. WT; *, NS vs. WT. Summarized are data for the following channels: wild-type (WT); 1921stop; ΔKPQ; 1885stop; K1921; K1885.
Figure 2.
The Na+ channel III-IV loop and C-T domain interact. Bacteria expressing His-tagged full-length (WT C-T) and truncated (1921stop, 1885stop) C-T variants (schematics in A, left) and GST-tagged III-IV loop variants (WT, ΔKPQ, IFM/QQQ) were lysed and used in pull-down assays to test for III-IV loop/C-T interactions. Pretermination translation products for the WT C-T and 1921stop construct were observed as smaller bands and detected by the His Western blot. (A) Shown is a representative experiment in which His-tagged C-T constructs (WT, 1921stop, and 1885stop, respectively; see
materials and methods
) are illustrated in the top, middle, and bottom panels were immobilized using GST-tagged III-IV loop variants (WT, IFM/QQQ, and ΔKPQ in the first second and third lanes, respectively) and detected using an anti-His monoclonal antibody. The extent of the III-IV linker used in this study ranged from D1471 through D1523. The mutations IFM and ΔKPQ refer to changes at residues 1485–1487 and 1505–1507, respectively. The control lane (GST alone, fourth lane) indicates specificity of the reactions. The last lane is a Western blot detecting the His-tagged C-T in the bacterial lysates. Note that the pretermination translation products for the WT C-T and 1921 smaller than 1885stop were also not pulled down by the III-IV linker. (B) Histogram of scanned pull downs (±SEM) normalized to total protein and corrected for background and total GST loaded (
materials and methods
). The number of experiments is indicated in the figure. Open bars correspond to interactions between His-tagged full length C-T construct and labeled III-IV linker variants. Filled bars correspond to wild-type III-IV loop interacting with 1921stop and 1885stop C-T constructs. **, NS vs. WT; *, P < 0.007 vs. WT.
Figure 3.
Sequence profile and molecular model of the Na+ channel III-IV loop. (A) Sequence profile for the SCN5A homologues found in the NCBI nt sequence database. The sequences are selected with five PSI-BLAST iterations (default parameters) with e-value cutoff equal to 10−2 using the SCN5A 1471–1523 as the seed (first row of the sequence profile). Only representative sequences are shown in the figure; no sequence pair in the profile has >90% sequence identity. (B) Hypothetical molecular model of the Na+ channel III-IV loop (residues 1471–1523) generated by local structural predictions. Shown in the figure are structures predicted by modeling based on the III-IV loop linear sequence. Shown is the predicted helix-turn-helix structure illustrating the predicted locations of the IFM motif (highlighted in red), KPQ (highlighted in green), and a P-rich region (highlighted in orange) discussed in the text and linked to functional and structural integrity of the channel. Underlined residues in the linear sequence correspond to predicted α helices in the model.
Figure 4.
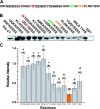
Mutation of a P-rich region of the Na+ channel III-IV loop disrupts interactions with the C-T domain and destabilizes inactivation. (A) III-IV loop linear sequence. (B) Pull down of His-tagged full-length C-T fusion proteins and glutamic acid scan of the GST-tagged III-IV linker constructs in which groups of four residues were systematically mutated to glutamic acid and detected using anti-His. (C) Histogram (±SEM) of C-T pull downs by the mutant III-IV GST fusion proteins normalized as described in
materials and methods
. The number of experiments for each construct is indicated in parentheses. *, P < .001 vs. PIPR; #, NS vs. PIPR.
Figure 5.
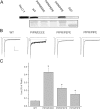
Preferential destabilization of inactivation by mutation of a P-rich region of the Na+ channel III-IV loop. (A) Whole-cell recordings of TTX-sensitive current in HEK 293 cells expressing wild-type (WT)-, PIPR/EEEE-, and KLGG/EEEE-mutated channels shown at low and high (insets, peak current off scale) gain. Shown are normalized (to peak current) and averaged (WT, n = 7; PIPR/EEEE, n = 6; KLGG/EEEE, n = 4) traces for each construct. Bars: 20 ms high and 50 ms low gain traces; 1% peak current, high gain traces. (B) The bar graph summarizes normalized mean (±SEM) Isus measured at 150 ms during voltage pulses to −10 mV and calculated as a percentage of peak current. *, P < 0.01 vs. WT and KLGG/EEEE.
Figure 6.
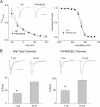
Kinetics, voltage dependence, and flecainide block of PIPR/EEEE channels. (A) The PIPR/EEEE mutation does not affect the kinetics of the onset of inactivation (left) or the voltage dependence of inactivation. Plotted in the left-hand graph are onset kinetics measured as the time to decay to half peak current (T1/2) vs. test pulse voltage for wild-type (WT) channels (n = 5) and PIPR/EEEE mutant channels (n = 4). There is no significant difference between these parameters at any voltage tested. Plotted in the right-hand graph are steady-state inactivation curves measured by preceding test pulses to −10 mV by a series of 500-ms conditioning pulses and normalizing measured test pulse current to that measured after the most negative (−140 mV) conditioning pulse. Normalized current is plotted against conditioning pulse voltage for WT (n = 6) and PIPR/EEEE channels (n = 8). Traces shown are normalized and averaged recordings of currents evoked by test pulses to −10 mV for WT (n = 5) and PIPR/EEEE (n = 4) channels. (B) Use-dependent block (UDB) of WT and PIPR/EEEE channels by flecainide (10 mM). Cells were held at −100 mV and trains of 50-test pulses (20 ms; −10 mV) were applied at pulse frequencies of 1 and 10 Hz. In each panel current traces are shown after the first (P1) and fiftieth (P50) pulse of the conditioning train in the presence of 10 mM flecainide. The bar graphs in the lower panel plot the percentage block ((P1 − P50)/P1)*100) recorded after applying trains at 1 Hz and 10 Hz for WT (n = 4) and PIPR/EEEE (n = 3) channels. *, P < 0.01.
Figure 7.
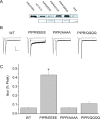
Disruption of interactions in a P-rich region destabilizes inactivation. (A, top) Pull down of His-tagged full-length C-T fusion by GST-tagged III-IV constructs in which the PIPR region was mutated either to alanine, glutamic acid, or glutamine and detected using anti-His. The Western blot lane demonstrates the migration of the His tagged C-T. The Ponceau red stain of the identical membrane used in the pull-down assay is shown in the lower row. (B) Mutation of PIPR motif (PIPR/EEEE) increases Isus. Whole-cell recordings of TTX-sensitive current in HEK 293 cells expressing wild-type (WT)-, PIPR/EEEE-, PIPR/AAAA-, and PIPR/QQQQ-mutated channels shown at low and high (insets, peak current off scale) gain. Shown are normalized (to peak current) and averaged (WT, n = 7; PIPR/EEEE, n = 6; PIPR/AAAA, n = 4; PIPR/QQQQ, n = 4) traces for each construct. Bars: 20 ms high and 50 ms low gain traces; 1% peak current, high gain traces. The bar graph summarizes normalized mean (±SEM) Isus measured at 150 ms during voltage pulses to −10 mV and calculated as a percentage of peak current. *, P <0.01, vs. WT.
Figure 8.
Disruption of III-IV loop–C-T interactions and sustained current is sensitive to the number of glutamate mutations in the PIPR region. (A) Pull down of His-C-T by WT, PIPR/EEEE, PIPR/PEPE, and PIPR/PIPE by III-IV GST fusion proteins. The His–C-T lane is a Western blot reflecting the C-T detected with a monoclonal His antibody. The Ponceau red stain of the identical membrane used in the pull-down assay is shown in the lower row. (B_)_ Mutation of PIPR motif (PIPR/EEEE) increases Isus. Whole-cell recordings of TTX-sensitive current in cells expressing wild-type (WT)-, PIPR/EEEE-, PIPR/PEPE-, and PIPR/PIPE-mutated channels shown at low and high (insets, peak current off scale) gain. Shown are normalized (to peak current) and averaged (WT, n = 7; PIPR/EEEE, n = 6; PIPR/PEPE, n = 4; PIPR/PIPE, n = 7) traces for each construct. Bars: 20 ms high and 50 ms low gain traces; 1% peak current, high gain traces. (C) The bar graph summarizes normalized mean (±SEM) Isus measured at 150 ms during voltage pulses to −10 mV and calculated as percentage peak current. *, P < 0.01 vs. WT.
Similar articles
- A critical role for transmembrane segment IVS6 of the sodium channel alpha subunit in fast inactivation.
McPhee JC, Ragsdale DS, Scheuer T, Catterall WA. McPhee JC, et al. J Biol Chem. 1995 May 19;270(20):12025-34. doi: 10.1074/jbc.270.20.12025. J Biol Chem. 1995. PMID: 7744852 - A critical role for the S4-S5 intracellular loop in domain IV of the sodium channel alpha-subunit in fast inactivation.
McPhee JC, Ragsdale DS, Scheuer T, Catterall WA. McPhee JC, et al. J Biol Chem. 1998 Jan 9;273(2):1121-9. doi: 10.1074/jbc.273.2.1121. J Biol Chem. 1998. PMID: 9422778 - Molecular properties of brain sodium channels: an important target for anticonvulsant drugs.
Catterall WA. Catterall WA. Adv Neurol. 1999;79:441-56. Adv Neurol. 1999. PMID: 10514834 Review. - A peptide segment critical for sodium channel inactivation functions as an inactivation gate in a potassium channel.
Patton DE, West JW, Catterall WA, Goldin AL. Patton DE, et al. Neuron. 1993 Nov;11(5):967-74. doi: 10.1016/0896-6273(93)90125-b. Neuron. 1993. PMID: 8240817 - Sodium channel inactivation in heart: a novel role of the carboxy-terminal domain.
Kass RS. Kass RS. J Cardiovasc Electrophysiol. 2006 May;17 Suppl 1:S21-S25. doi: 10.1111/j.1540-8167.2006.00381.x. J Cardiovasc Electrophysiol. 2006. PMID: 16686678 Review.
Cited by
- Late Na+ current produced by human cardiac Na+ channel isoform Nav1.5 is modulated by its beta1 subunit.
Maltsev VA, Kyle JW, Undrovinas A. Maltsev VA, et al. J Physiol Sci. 2009 May;59(3):217-25. doi: 10.1007/s12576-009-0029-7. Epub 2009 Mar 3. J Physiol Sci. 2009. PMID: 19340536 Free PMC article. - Novel heterozygous mutation c.4282G>T in the SCN5A gene in a family with Brugada syndrome.
Zhu JF, DU LL, Tian Y, DU YM, Zhang L, Zhou T, Tian LI. Zhu JF, et al. Exp Ther Med. 2015 May;9(5):1639-1645. doi: 10.3892/etm.2015.2361. Epub 2015 Mar 16. Exp Ther Med. 2015. PMID: 26136871 Free PMC article. - Molecular basis of ranolazine block of LQT-3 mutant sodium channels: evidence for site of action.
Fredj S, Sampson KJ, Liu H, Kass RS. Fredj S, et al. Br J Pharmacol. 2006 May;148(1):16-24. doi: 10.1038/sj.bjp.0706709. Br J Pharmacol. 2006. PMID: 16520744 Free PMC article. - A double tyrosine motif in the cardiac sodium channel domain III-IV linker couples calcium-dependent calmodulin binding to inactivation gating.
Sarhan MF, Van Petegem F, Ahern CA. Sarhan MF, et al. J Biol Chem. 2009 Nov 27;284(48):33265-74. doi: 10.1074/jbc.M109.052910. Epub 2009 Oct 5. J Biol Chem. 2009. PMID: 19808664 Free PMC article. - Functional characterization of a novel frameshift mutation in the C-terminus of the Nav1.5 channel underlying a Brugada syndrome with variable expression in a Spanish family.
Dolz-Gaitón P, Núñez M, Núñez L, Barana A, Amorós I, Matamoros M, Pérez-Hernández M, González de la Fuente M, Alvarez-López M, Macías-Ruiz R, Tercedor-Sánchez L, Jiménez-Jáimez J, Delpón E, Caballero R, Tamargo J. Dolz-Gaitón P, et al. PLoS One. 2013 Nov 25;8(11):e81493. doi: 10.1371/journal.pone.0081493. eCollection 2013. PLoS One. 2013. PMID: 24363796 Free PMC article.
References
- Abriel, H., C. Cabo, X.H. Wehrens, I. Rivolta, H.K. Motoike, M. Memmi, C. Napolitano, S.G. Priori, and R.S. Kass. 2001. Novel arrhythmogenic mechanism revealed by a long-qt syndrome mutation in the cardiac Na+ channel. Circ. Res. 88:740–745. - PubMed
- Ackerman, M.J., B.L. Siu, W.Q. Sturner, D.J. Tester, C.R. Valdivia, J.C. Makielski, and J.A. Towbin. 2001. Postmortem molecular analysis of SCN5A defects in sudden infant death syndrome. JAMA. 286:2264–2269. - PubMed
- Baroudi, G., and M. Chahine. 2000. Biophysical phenotypes of SCN5A mutations causing long QT and Brugada syndromes. FEBS Lett. 487:224–228. - PubMed
- Bennett, P.B., K. Yazawa, N. Makita, and A.L. George. 1995. Molecular mechanism for an iniherited cardiac arrhythmia. Nature. 376:683–685. - PubMed
Publication types
MeSH terms
Substances
Grants and funding
- P01 HL067849/HL/NHLBI NIH HHS/United States
- R01 HL056810/HL/NHLBI NIH HHS/United States
- P01-HL67849/HL/NHLBI NIH HHS/United States
- R01 HL56810/HL/NHLBI NIH HHS/United States
