Perforin and gamma interferon-mediated control of coronavirus central nervous system infection by CD8 T cells in the absence of CD4 T cells - PubMed (original) (raw)
Perforin and gamma interferon-mediated control of coronavirus central nervous system infection by CD8 T cells in the absence of CD4 T cells
Cornelia C Bergmann et al. J Virol. 2004 Feb.
Abstract
Infection of the central nervous system (CNS) with the neurotropic JHM strain of mouse hepatitis virus produces acute and chronic demyelination. The contributions of perforin-mediated cytolysis and gamma interferon (IFN-gamma) secretion by CD8(+) T cells to the control of infection and the induction of demyelination were examined by adoptive transfer into infected SCID recipients. Untreated SCID mice exhibited uncontrolled virus replication in all CNS cell types but had little or no demyelination. Memory CD8(+) T cells from syngeneic wild-type (wt), perforin-deficient, or IFN-gamma-deficient (GKO) donors all trafficked into the infected CNS in the absence of CD4(+) T cells and localized to similar areas. Although CD8(+) T cells from all three donors suppressed virus replication in the CNS, GKO CD8(+) T cells expressed the least antiviral activity. A distinct viral antigen distribution in specific CNS cell types revealed different mechanisms of viral control. While wt CD8(+) T cells inhibited virus replication in all CNS cell types, cytolytic activity in the absence of IFN-gamma suppressed the infection of astrocytes, but not oligodendroglia. In contrast, cells that secreted IFN-gamma but lacked cytolytic activity inhibited replication in oligodendroglia, but not astrocytes. Demyelination was most severe following viral control by wt CD8(+) T cells but was independent of macrophage infiltration. These data demonstrate the effective control of virus replication by CD8(+) T cells in the absence of CD4(+) T cells and support the necessity for the expression of distinct effector mechanisms in the control of viral replication in distinct CNS glial cell types.
Figures
FIG. 1.
JHMV replication in the CNS of SCID and wt mice. SCID and syngeneic wt BALB/c control mice were infected with 500 PFU of JHMV. Mice were sacrificed at various times p.i. and JHMV replication in the CNS was examined by plaque assays of brain homogenates. Each point is the average for three to five mice per group, and the data are representative of three separate experiments.
FIG. 2.
Pathological changes in the CNS of SCID versus wt mice infected with JHMV. JHMV antigen and inflammation in the brains of JHMV-infected SCID (A) and wt (B) mice at day 14 p.i. (immunoperoxidase stain for JHMV antigen, with hematoxylin counterstain) are shown. (A) The area outlined by arrowheads contains numerous antigen-positive cells. (B) Only rare antigen-positive cells are seen (arrows). JHMV antigen and inflammation in the spinal cords of JHMV-infected SCID (C) and wt (D) mice are also shown. The extent of the white matter (WM) and gray matter (GM) is indicated by double-headed arrows. (C) Numerous antigen-positive cells are seen in the white matter (arrows). (D) Only very rare antigen-positive cells are seen in the white matter (arrow). (E and F) Luxol fast blue staining of spinal cord sections showed no demyelination in infected SCID mice (E) and large areas of demyelination (arrow heads) in infected wt mice (F). Bar = 50 μm.
FIG. 3.
Memory CD8+ T cells suppress JHMV replication within the CNS. JHMV replication was analyzed at days 10 and 14 p.i. in the CNS of untreated JHMV-infected SCID mice (Co) and recipients of 5 × 10⁶ purified CD8+ T cells derived from JHMV-immune wt, PKO, and GKO donors. Data represent the averages of three to six mice per group and are representative of three or four separate experiments.
FIG.4.
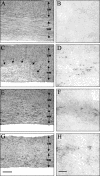
Inflammation and CD8+-T-cell distribution in spinal cords of JHMV-infected SCID mice reconstituted with CD8+ T cells at day 14 p.i. The extent of the spinal cord white matter (WM) and gray matter (GM) is indicated by double-headed arrows. Sections of infected SCID mice show no inflammatory infiltrates (A) or CD8+ T cells (B). Infected SCID mice that are recipients of 5 × 10⁶ purified memory CD8+ T cells derived from wt donors show prominent demyelination (outlined by arrows) (C) and CD8+-T-cell infiltrates in the white matter (D). Infected SCID mice that are recipients of CD8+ T cells derived from GKO donors show white matter inflammation (E) and CD8+-T-cell infiltrates (F). Infected SCID mice that are recipients of CD8+ T cells derived from PKO donors show white matter inflammation (G) and CD8+-T-cell infiltrates (H). Panels A, C, E, and G were stained with hematoxylin and eosin. Bar = 200 μm. Panels B, D, F, and H were stained for CD8+ T cells with immunoperoxidase. Bar = 100 μm.
FIG. 5.
Viral antigen distribution in brains of JHMV-infected SCID mice reconstituted with CD8+ T cells. Brain sections from infected SCID mice at 10 days p.i. show numerous antigen-positive astrocytes and oligodendroglia in the white matter (A). Infected SCID recipients of memory CD8+ T cells derived from wt donors show fewer antigen-positive cells (B). Infected SCID recipients of PKO-derived CD8+ T cells (C) show many antigen-positive astrocytes (inset), but very few antigen-positive oligodendroglia. Infected SCID recipients of GKO-derived CD8+ T cells (D) show many antigen-positive oligodendroglia (inset), but very few antigen-positive astrocytes. Panels were stained for viral antigen with immunoperoxidase, with a hematoxylin counterstain. Bar = 100 μm.
FIG. 6.
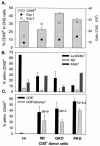
Composition of CNS infiltrates following transfer of donor CD8+ T cells. Single-cell suspensions from brains were prepared from infected untreated SCID mice (co) or recipients of CD8+ T cells from wt, GKO, and PKO immune donors, as indicated, at 10 days p.i. (n = 3 to 4/group). CNS-derived cells were stained with anti-CD45, anti-Ly-6G/6C, anti-NK, anti-F4/80, anti-I-A/Ed, anti-CD8, Ld-N318 tetramer, and anti-CD4 antibodies and were analyzed by flow cytometry. All data depict average percentages ± standard errors from two independent experiments. (A) Bars depict the percentages of infiltrating CD45hi cells in total viable CMCs; the live gate R1 region typically comprised 40 to 50% of total events. Total yields of viable cells per CNS from two separate experiments (n = 3 or 4/group) are shown for reference. (B) Relative percentages of Ly-6G/6C+ class II− neutrophils, NK cells, and class II+ F4/80+ macrophages within the infiltrating CD45hi population. Data were calculated based on setting the CD45hi population to 100%. (C) Relative percentages of total CD8+ and tetramer-positive CD8+ cells within the CD45hi population. The numbers adjacent to the columns depict the relative percentages of tetramer-positive cells within the respective CD8+ populations. CD4+ T cells were barely detectable in the CD45hi population (<4%) for all recipients. Data are representative for two additional experiments in which CMCs from brains and spinal cords were pooled.
FIG. 7.
MHC expression on microglia/macrophages following transfer of donor CD8+ T cells. Data are shown for single-cell brain suspensions from infected untreated SCID mice (co) or recipients of CD8+ T cells from wt, GKO, or PKO immune donors at 10 days p.i. (n = 3 or 4/group). Cells were stained with APC-conjugated anti-CD45 antibody and various combinations of PE-conjugated anti-F4/80, FITC-conjugated anti-class I Dd, and FITC-conjugated anti-class II I-A/Ed and were analyzed by flow cytometry. (Top and middle) Density plots gated on total CD45+ cells comprising both CD45lo resident microglia and CD45hi infiltrating cells. Quadrants were set to separate MHC-negative and -positive (x axis) microglia (CD45lo) from infiltrating (CD45hi) cells (y axis). Numbers represent percentages of class I Dd+ or class II I-A/Ed+ cells within the microglia population. Parentheses in the lower right quadrant indicate mean fluorescence intensities of class I+ or class II+ microglia. Class I and class II expression was undetectable on microglia in uninfected mice (data not shown). (Bottom) Density plots gated on CD45hi cells comparing class II expression on infiltrating macrophages. The rectangle comprises class II+ F4/80+ infiltrating macrophages; numbers depict percentages within the CD45hi population, as well as the mean fluorescence intensities of class II expression (in parentheses).
Similar articles
- Perforin-mediated effector function within the central nervous system requires IFN-gamma-mediated MHC up-regulation.
Bergmann CC, Parra B, Hinton DR, Chandran R, Morrison M, Stohlman SA. Bergmann CC, et al. J Immunol. 2003 Mar 15;170(6):3204-13. doi: 10.4049/jimmunol.170.6.3204. J Immunol. 2003. PMID: 12626579 - IFN-gamma is required for viral clearance from central nervous system oligodendroglia.
Parra B, Hinton DR, Marten NW, Bergmann CC, Lin MT, Yang CS, Stohlman SA. Parra B, et al. J Immunol. 1999 Feb 1;162(3):1641-7. J Immunol. 1999. PMID: 9973424 - Contributions of CD8+ T cells and viral spread to demyelinating disease.
Marten NW, Stohlman SA, Atkinson RD, Hinton DR, Fleming JO, Bergmann CC. Marten NW, et al. J Immunol. 2000 Apr 15;164(8):4080-8. doi: 10.4049/jimmunol.164.8.4080. J Immunol. 2000. PMID: 10754301 - MHV infection of the CNS: mechanisms of immune-mediated control.
Marten NW, Stohlman SA, Bergmann CC. Marten NW, et al. Viral Immunol. 2001;14(1):1-18. doi: 10.1089/08828240151061329. Viral Immunol. 2001. PMID: 11270593 Review. - Pathogenesis of acute and chronic central nervous system infection with variants of mouse hepatitis virus, strain JHM.
Templeton SP, Perlman S. Templeton SP, et al. Immunol Res. 2007;39(1-3):160-72. doi: 10.1007/s12026-007-0079-y. Immunol Res. 2007. PMID: 17917063 Free PMC article. Review.
Cited by
- Regulatory T cells in arterivirus and coronavirus infections: do they protect against disease or enhance it?
Cecere TE, Todd SM, Leroith T. Cecere TE, et al. Viruses. 2012 May;4(5):833-46. doi: 10.3390/v4050833. Epub 2012 May 15. Viruses. 2012. PMID: 22754651 Free PMC article. Review. - Astrocyte expression of a dominant-negative interferon-gamma receptor.
Hindinger C, Gonzalez JM, Bergmann CC, Fuss B, Hinton DR, Atkinson RD, Macklin WB, Stohlman SA. Hindinger C, et al. J Neurosci Res. 2005 Oct 1;82(1):20-31. doi: 10.1002/jnr.20616. J Neurosci Res. 2005. PMID: 16118798 Free PMC article. - Shifting hierarchies of interleukin-10-producing T cell populations in the central nervous system during acute and persistent viral encephalomyelitis.
Puntambekar SS, Bergmann CC, Savarin C, Karp CL, Phares TW, Parra GI, Hinton DR, Stohlman SA. Puntambekar SS, et al. J Virol. 2011 Jul;85(13):6702-13. doi: 10.1128/JVI.00200-11. Epub 2011 Apr 27. J Virol. 2011. PMID: 21525347 Free PMC article. - The microbiota protects from viral-induced neurologic damage through microglia-intrinsic TLR signaling.
Brown DG, Soto R, Yandamuri S, Stone C, Dickey L, Gomes-Neto JC, Pastuzyn ED, Bell R, Petersen C, Buhrke K, Fujinami RS, O'Connell RM, Stephens WZ, Shepherd JD, Lane TE, Round JL. Brown DG, et al. Elife. 2019 Jul 16;8:e47117. doi: 10.7554/eLife.47117. Elife. 2019. PMID: 31309928 Free PMC article. - Sustained Infiltration of Neutrophils Into the CNS Results in Increased Demyelination in a Viral-Induced Model of Multiple Sclerosis.
Skinner DD, Syage AR, Olivarria GM, Stone C, Hoglin B, Lane TE. Skinner DD, et al. Front Immunol. 2022 Sep 29;13:931388. doi: 10.3389/fimmu.2022.931388. eCollection 2022. Front Immunol. 2022. PMID: 36248905 Free PMC article.
References
- Badovinac, V. P., A. R. Tvinnereim, and J. T. Harty. 2000. Regulation of antigen specific CD8+ T cell homeostasis by perforin and interferon-γ. Science 290:1354-1358. - PubMed
- Barac-Latas, V., G. Suchanek, H. Breitschopf, A. Stuehler, H. Wege, and H. Lassmann. 1997. Patterns of oligodendrocyte pathology in coronavirus-induced subacute demyelinating encephalomyelitis in the Lewis rat. Glia 19:1-12. - PubMed
- Bergmann, C. C., J. A. Altman, D. Hinton, and S. A. Stohlman. 1999. Inverted immunodominance and impaired cytolytic function of CD8+ T cells during viral persistence in the central nervous system. J. Immunol. 163:3379-3387. - PubMed
- Bergmann, C. C., C. Ramakrishna, M. Kornacki, and S. A. Stohlman. 2001. Impaired T cell immunity in B cell deficient mice following viral central nervous system infection. J. Immunol. 167:1575-1583. - PubMed
- Bergmann, C. C., B. Parra, D. Hinton, C. Ramakrishna, M. Morrison, and S. Stohlman. 2003. Perforin mediated effector function within the CNS requires IFN-g mediated MHC upregulation. J. Immunol. 170:3204-3213. - PubMed
Publication types
MeSH terms
Substances
LinkOut - more resources
Full Text Sources
Research Materials


