The region 3' to Xist mediates X chromosome counting and H3 Lys-4 dimethylation within the Xist gene - PubMed (original) (raw)
The region 3' to Xist mediates X chromosome counting and H3 Lys-4 dimethylation within the Xist gene
Céline Morey et al. EMBO J. 2004.
Abstract
A counting process senses the X chromosome/autosome ratio and ensures that X chromosome inactivation (XCI) initiates in the female (XX) but not in the male (XY) mouse embryo. Counting is regulated by the X-inactivation centre, which contains the Xist gene. Deleting 65 kb 3' to Xist in XO embryonic stem (ES) cells affects counting and results in inappropriate XCI upon differentiation. We show here that normal counting can be rescued in these deleted ES cells using cre/loxP re-insertion, and refine the location of elements controlling counting within a 20 kb bipartite domain. Furthermore, we show that the 65 kb deletion also leads to inappropriate XCI in XY differentiated ES cells, which excludes the involvement of sex-specific mechanisms in the initiation of XCI. At the chromatin level, we have found that the Xist gene corresponds to a peak of H3 Lys-4 dimethylation, which is dramatically and specifically affected by the deletion 3' to Xist. Our results raise the possibility that H3 Lys-4 dimethylation within Xist may be functionally implicated in the counting process.
Figures
Figure 1
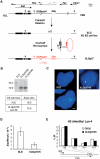
The 37 kb re-inserted DNA is refolded into a functional chromatin structure and restores normal Xist expression in undifferentiated XO ES cells. (A) Deletion and complementation strategies (Morey et al, 2001) in XO ES cells. The resulting 65-kb-deleted and 37-kb-complemented alleles are depicted underneath the map of the Xist locus. Arrows indicate the direction of transcription and arrowheads identify promoter sequences. Solid boxes, Xist exons; the plain and dotted lines show the exonic and intronic Tsix structure with major and minor Tsix promoters symbolized as black and grey arrowheads; hatched box, the Xite element; small arrow, intergenic antisense transcription constitutive of the Xite element (Ogawa and Lee, 2003); grey box, DNA probe; n, _Nde_I restriction sites relevant to the analysis in (B). (B) Southern-blot analysis and expected sizes of the _Nde_I restriction fragments detected with the DNA probe depicted in (A). Two re-inserted ES cell clones XLDp37#5 and XLDp37#6 were analysed. The structure of the XLDp37#5 and XLDp37#6 ES cell lines was also confirmed by PCRs at the boundaries of the 37 kb re-inserted region. (C) Two-colour RNA-FISH analysis for Xist (L510, green) and DXPas34/Tsix (Debrand et al, 1999) (red) on DAPI-stained undifferentiated XLD and XLDp37#5 ES cells. Overlapping green and red signals are seen as yellow. The bar equals 5 μm. The XLD ES cells show a faint Xist pinpoint (upper left panel) or scattered dots (in 15% of nuclei, _n_=200, down left panel), whereas a normal Xist pinpoint signal superimposed on a restored DXPas34/Tsix expression is detected in the undifferentiated XLDp37#5 ES cell line. (D) Dual real-time quantitative RT–PCR for Xist (spanning exons 5 and 6) and Rrm2 (ribonucleoside diphosphate reductase M2) (Lee et al, 1999b) as a reporter in undifferentiated XLD and XLDp37#5 ES cell lines. Means±SD (_n_=4) of Xist transcripts are standardized over Rrm2 RNA and expressed in arbitrary units as previously described (Morey et al, 2001). Using the 18S ribosomal RNA as an alternative reporter gave essentially similar results in all the experiments of this paper (data not shown). The elevated Xist level in XLD ES cells is restored to a normal low level in the XLDp37#5 ES cell line. This level is not significantly different from the amount of Xist transcripts originating from the same allele in the parental XX ES cell line. Similar results were obtained in at least two independent ES cell cultures for each ES cell line. (E) ChIP analysis of H3 Lys-4 dimethylation within the 37 kb re-inserted region in the undifferentiated XLDp37#5 ES cell line. Immunoprecipitated DNA was analysed by real-time quantitative PCR. The location of the primer pairs is represented on the small map below the graph. A 5 kb region around the DXPas34 locus, which has a crucial function in the regulation of the Xist locus, was analysed. The graphs show the %IP obtained for each primer pairs and each ES cell line. CK35 and XLDp37 harbour very similar H3 Lys-4 dimethylation profiles indicative of an accurate chromatin refolding of the 37 kb region in the XLDp37#5 ES cell line. All experiments described in this figure have been carried out in parallel on the XLDp37#6 ES cell line with essentially identical results (data not shown).
Figure 2
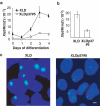
Inappropriate X-inactivation in the differentiated XLD XO ES cell line is prevented upon re-insertion of 37 kb of DNA lying 3′ to Xist. (A) Quantification of Xist RNAs (as described in Figure 1D) during differentiation into embryoid bodies. The steady-state level of Xist RNAs is upregulated during ES cell differentiation in XLD, but not in the XLDp37#5 ES cell line. (B) Quantification of Xist RNA standardized over Rrm2 in the XLD and XLDp37#5 ES cells differentiated for 3 days in low-density cell culture. (C) In the same differentiation experiment as (B), Xist expression was assessed by RNA-FISH with the L510 probe (green) on DAPI-stained nuclei. The bar equals 25 μm. Respectively 60 and 9% of total nuclei exhibited a Xist domain (_n_=200) in XLD and XLDp37#5 ES cells differentiated for 3 days, consistent with a repression of Xist accumulation consecutive to the 37 kb complementation. Two independent differentiations of XLDp37#5 and of XLDp37#6 ES cell lines using the two differentiation systems gave similar results.
Figure 3
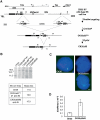
Deleting 65 kb 3′ of Xist in ES cells results in Xist RNA upregulation and alters Xist RNA distribution within the nuclei of undifferentiated ES cells. (A) Strategy for the 65 kb deletion in CK35 XY ES cells. Targeting vectors and the structures resulting after Cre and Flp expression are shown. Black triangles, _lox_P sites; open diamonds, frt sites. Open triangles indicate the primer pair (DC651Up-Del1Lo) used for the PCR screening of the deleted clones. Arrowheads represent promoter sequences and pA, a polyadenylation signal. (B) Southern-blot analysis of the CK35Δ65 ES cells. The analysis was performed using the _Nde_I restriction enzyme (n, _Nde_I restriction sites) and a probe located in Xist exon 7 (grey box). The flp/frt cassette excision was carried out on two independent cre/_lox_P-deleted clones CK35Δ65Pur#1 and CK35Δ65Pur#2, and gave rise, respectively, to cell lines CK35Δ65#3 and CK35Δ65#5. The Southern-blot analysis confirmed the genomic structure of the deleted alleles. (C) RNA-FISH for Xist (green) and DXPas34/Tsix (red) on CK35 and CK35Δ65#3 on DAPI-stained nuclei of undifferentiated ES cells. The bar equals 5 μm. CK35Δ65#3 ES cells exhibit a reduced Xist pinpoint (upper right panel) or faint Xist RNA signals diffused around the Xist transcription site (down right panel). (D) Quantification of Xist transcripts in undifferentiated CK35 and CK35Δ65#3 ES cell lines using quantitative real-time RT–PCR for Xist and the Rrm2 reporter gene. CK35Δ65#3 ES cells show a four-fold increase in Xist steady-state levels compared to the wild-type CK35 ES cell line. Similar results were obtained for the CK35Δ65#5 ES cell line.
Figure 4
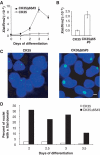
Inappropriate initiation of X-inactivation occurs in differentiated CK35Δ65 ES cells. (A) Xist expression measured in real-time quantitative RT–PCR during ES cell differentiation into embryoid bodies. CK35Δ65#3 ES cell line shows an increase in Xist RNA levels during differentiation into embryoid bodies. (B) Xist steady state levels measured by real-time RT–PCR and normalized using the Rrm2 reporter gene in CK35 and CK35Δ65#3 ES cells differentiated for 3 days in low-density cell culture. (C) In the same differentiation experiment, Xist RNA-FISH on DAPI-stained nuclei of CK35 and CK35Δ65#3 ES cell lines differentiated for 3 days. The bar equals 25 μm. High levels of Xist expression are associated with inappropriate Xist accumulation at the XΔ65 in the CK35Δ65#3 ES cell line. (D) Kinetics of Xist accumulation during ES cell differentiation under low-density cell culture conditions. The proportion of nuclei showing an accumulation of Xist RNA between days 2 and 3.5 of differentiation is illustrated. A total of 100–200 nuclei were scored for each differentiation time point. Two independent experiments for CK35Δ65#3 and CK35Δ65#5 and CK35Δ65Pur#1 and CK35Δ65Pur#2 using both differentiation systems gave similar results.
Figure 5
Inappropriate Xist accumulations in CK35Δ65 differentiated ES cells result in efficient X-linked genes silencing. (A–C) Silencing of the Chic1 gene. Two-colour RNA-FISH using probes for Chic1 (red) and Xist (green) in the CK35Δ65#3 ES cell line differentiated for 3 days in low-density cell culture. (A) shows an example of a nucleus where XCI has not yet occurred. In all, 93% of the cells presented a detectable Chic1 signal. To evaluate silencing, the number of nuclei (_n_=200) displaying a high-level Xist expression associated (B) or not (C) with a Chic1 signal was determined. Percentages are indicated. The bar equals 5 μm. (D–F) Silencing of the Mecp2 gene. A probe specific for the Mecp2 gene (red) was used to perform an analysis identical to that in (A–C). A 75% frequency of detection of Mecp2 was obtained in cells in which initiation of XCI had not yet occurred (D), whereas only 16% of the cells with an Xist RNA–FISH domain demonstrated a signal for Mecp2 (E).
Figure 6
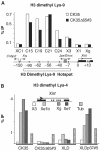
Effects of mutations 3′ to Xist on H3 Lys-9 and Lys-4 dimethylation 5′ and within the Xist gene in ES cells. (A) ChIP analysis of H3 Lys-9 dimethylation in the hotspot region and in the Xist locus in the CK35 and CK35Δ65 ES cell lines. The immunoprecipitated chromatin was analysed by real-time quantitative PCR using assays spanning over 150 kb of the H3 Lys-9 dimethyl hotspot region 5′ to Xist (Heard et al, 2001). Two primer pairs located within the Xist gene were also used (X1 and Xg). Coordinates of the assays relative to the Xist P1 promoter are indicated in kilobases. High levels of H3 lys-9 methylation over a 150 kb region 5′ to Xist were observed in both the CK35 and the CK35Δ65#3 ES cell lines. No significant differences between the CK35 and CK35Δ65#3 ES cell lines in the levels of H3 Lys-9 methylation at the positions tested could be reproducibly observed in the course of repeat experiments. Results from a single representative experiment are shown. (B) ChIP analysis of H3 Lys-4 dimethylation within the Xist gene in wild-type and mutated ES cells. PCR assay X3 is located 7 kb upstream of the Xist promoter P1. PCR assays Xe1b, Xg and Xe7 are located, respectively, within Xist exon 1, exon 5–intron 5 junction and exon 7. The ChIP efficiencies are controlled using PCR assays located within the _α_-tubulin (stripped columns), myc and G6pd genes (not shown). In the CK35 wild-type ES cell line, high levels of H3 Lys-4 methylation were observed within the Xist gene (assays Xe1b, Xg and Xe7), but not upstream of it (assay X3). A drastic loss of H3 Lys-4 dimethylation is observed in the Xist gene of the 65-kb-deleted X in the CK35Δ65#3 ES cell line. The levels of H3 Lys-4 dimethylation are similarly low in the Xist gene in the XLD ES cell line, and increased in the complemented XLDp37#5 ES cell line. Three independent experiments provided results essentially identical to the example shown here.
Figure 7
Schematic representation of the roles of the region 3′ to Xist in counting and in control of H3 Lys-9 and Lys-4 dimethylation at the Xist locus. The schema depicts the Xist locus, as well as the DXPas34/Tsix and Xite elements, which have been previously excluded from having a function in counting. The location of the bipartite 20 kb region identified in this study as containing an element of counting is shown above the central schema. The positions tested for histone H3 Lys-9 and Lys-4 dimethylation are, respectively, indicated by blue and yellow stars. The role of the region lying 3′ to Xist in histone H3 modification is illustrated in the lower part of the diagram. In ES cells, the 65 kb region has no effect on H3 Lys-9 dimethylation in either the hotspot region or the Xist locus. In contrast, the region 3′ to Xist targets the deposition of the Lys-4 dimethyl form of H3 to within the body of the Xist gene. This regulation is specifically supported by the proximal 37 kb subregion of the 65 kb span.
Similar articles
- Tsix transcription across the Xist gene alters chromatin conformation without affecting Xist transcription: implications for X-chromosome inactivation.
Navarro P, Pichard S, Ciaudo C, Avner P, Rougeulle C. Navarro P, et al. Genes Dev. 2005 Jun 15;19(12):1474-84. doi: 10.1101/gad.341105. Genes Dev. 2005. PMID: 15964997 Free PMC article. - X-chromosome inactivation during spermatogenesis is regulated by an Xist/Tsix-independent mechanism in the mouse.
McCarrey JR, Watson C, Atencio J, Ostermeier GC, Marahrens Y, Jaenisch R, Krawetz SA. McCarrey JR, et al. Genesis. 2002 Dec;34(4):257-66. doi: 10.1002/gene.10163. Genesis. 2002. PMID: 12434336 - X inactivation counting and choice is a stochastic process: evidence for involvement of an X-linked activator.
Monkhorst K, Jonkers I, Rentmeester E, Grosveld F, Gribnau J. Monkhorst K, et al. Cell. 2008 Feb 8;132(3):410-21. doi: 10.1016/j.cell.2007.12.036. Cell. 2008. PMID: 18267073 - Recent advances in X-chromosome inactivation.
Heard E. Heard E. Curr Opin Cell Biol. 2004 Jun;16(3):247-55. doi: 10.1016/j.ceb.2004.03.005. Curr Opin Cell Biol. 2004. PMID: 15145348 Review. - An embryonic story: analysis of the gene regulative network controlling Xist expression in mouse embryonic stem cells.
Navarro P, Avner P. Navarro P, et al. Bioessays. 2010 Jul;32(7):581-8. doi: 10.1002/bies.201000019. Bioessays. 2010. PMID: 20544740 Review.
Cited by
- Dynamic interplay and function of multiple noncoding genes governing X chromosome inactivation.
Yue M, Charles Richard JL, Ogawa Y. Yue M, et al. Biochim Biophys Acta. 2016 Jan;1859(1):112-20. doi: 10.1016/j.bbagrm.2015.07.015. Epub 2015 Aug 7. Biochim Biophys Acta. 2016. PMID: 26260844 Free PMC article. Review. - Dicer regulates Xist promoter methylation in ES cells indirectly through transcriptional control of Dnmt3a.
Nesterova TB, Popova BC, Cobb BS, Norton S, Senner CE, Tang YA, Spruce T, Rodriguez TA, Sado T, Merkenschlager M, Brockdorff N. Nesterova TB, et al. Epigenetics Chromatin. 2008 Oct 27;1(1):2. doi: 10.1186/1756-8935-1-2. Epigenetics Chromatin. 2008. PMID: 19014663 Free PMC article. - Analysis of the Xist RNA isoforms suggests two distinctly different forms of regulation.
Ma M, Strauss WM. Ma M, et al. Mamm Genome. 2005 Jun;16(6):391-404. doi: 10.1007/s00335-004-2464-3. Mamm Genome. 2005. PMID: 16075366 - A boundary element between Tsix and Xist binds the chromatin insulator Ctcf and contributes to initiation of X-chromosome inactivation.
Spencer RJ, del Rosario BC, Pinter SF, Lessing D, Sadreyev RI, Lee JT. Spencer RJ, et al. Genetics. 2011 Oct;189(2):441-54. doi: 10.1534/genetics.111.132662. Epub 2011 Aug 11. Genetics. 2011. PMID: 21840866 Free PMC article. - A Primary Role for the Tsix lncRNA in Maintaining Random X-Chromosome Inactivation.
Gayen S, Maclary E, Buttigieg E, Hinten M, Kalantry S. Gayen S, et al. Cell Rep. 2015 May 26;11(8):1251-65. doi: 10.1016/j.celrep.2015.04.039. Epub 2015 May 14. Cell Rep. 2015. PMID: 25981039 Free PMC article.
References
- Clerc P, Avner P (1998) Role of the region 3′ to Xist exon 6 in the counting process of X-chromosome inactivation. Nat Genet 19: 249–253 - PubMed
- Gartler SM, Riggs AD (1983) Mammalian X-chromosome inactivation. Annu Rev Genet 17: 155–190 - PubMed
Publication types
MeSH terms
Substances
LinkOut - more resources
Full Text Sources
Other Literature Sources
Molecular Biology Databases
