Dopaminergic modulation of prefrontal cortical input to nucleus accumbens neurons in vivo - PubMed (original) (raw)
Dopaminergic modulation of prefrontal cortical input to nucleus accumbens neurons in vivo
Anne Marie Brady et al. J Neurosci. 2004.
Abstract
Dopaminergic transmission in the nucleus accumbens has been proposed to modulate the effects of converging excitatory inputs from the cortex, hippocampus, and amygdala. Here, we used in vivo intracellular recording in anesthetized rats to examine the response of nucleus accumbens neurons to stimulation of the prefrontal cortex (PFC) and the ventral tegmental area (VTA). The EPSP elicited in accumbens neurons by PFC stimulation was attenuated by VTA train stimulation in a pattern mimicking dopamine cell burst firing. PFC-elicited EPSPs were smaller in amplitude and faster to decay after VTA stimulation. These changes could not be explained by membrane depolarization alone, because EPSPs evoked during the sustained depolarization after VTA stimulation were significantly smaller than EPSPs evoked during spontaneously occurring up states. Furthermore, no attenuation of PFC-elicited responses was observed during depolarization produced by positive current injection through the recording electrode. Administration of a D1 antagonist (SCH 23390; 0.5 mg/kg, i.p.) had no effect on the VTA reduction of PFC-elicited responses, whereas administration of a D2 antagonist (eticlopride; 0.5 mg/kg, i.p.) reversed the reduction of PFC inputs when the analysis was limited to comparisons with spontaneous up states. These results suggest that the ability of PFC inputs to drive accumbens neurons is dampened by dopamine acting primarily at D2 receptors. Along with previous reports of dopaminergic attenuation of limbic afferents to the accumbens, these findings support the hypothesis that dopamine mediates the selection and integration of excitatory inputs and thus shapes information processing in accumbens output neurons.
Figures
Figure 1.
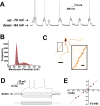
A majority (91%) of neurons recorded in the nucleus accumbens exhibited a bimodal membrane potential. A, A representative trace from a bimodal neuron illustrating spontaneous oscillations between a hyperpolarized down state and depolarized up state, indicated by the arrows, at a frequency of 0.8 Hz. The firing rate of this cell was 0.4 Hz, with spikes occurring only during up states. B, Frequency distribution of membrane potential values for the neuron illustrated in A. This histogram could be fitted with high confidence (_R_2 = 0.94) to a bimodal Gaussian distribution, in which the two peaks correspond to the down and up states. C, Image of the cell illustrated in A, filled with Neurobiotin and visualized with immunohistochemistry. All of the recovered cells exhibited a morphology consistent with that of medium spiny neurons. Inset, Closer detail of spines on the indicated dendrite. Scale bars: C, 30 μm; C, inset, 10μm. D, Injection of alternating positive and negative current steps to the cell shown in A produced characteristic voltage deflections, with the highest positive current culminating in spikes. E, Current–voltage plot for the traces shown in D. This cell had an input resistance of 51.8 MΩ. For all of the cells, only current pulses that were delivered in the down state and did not result in spikes were included in the calculation of input resistance. In D, the most depolarized trace resulted in spikes and is shown for illustration only.
Figure 2.
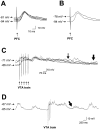
Single-pulse stimulation (0.5–1.0 mA; 0.5 msec) of the PFC elicited an EPSP, whereas train stimulation (5 pulses; 1.0 mA; 20 Hz) of the VTA evoked a sustained depolarization response in most accumbens neurons. A, Overlay of six repetitions of PFC stimulation (1.0 mA) to one cell. The average EPSP amplitude in this cell was 21.8 mV. B, Detail of PFC stimulations in the up and down state of the cell in A. In this cell, the average EPSP amplitude was 18.5 mV from the up state and 27.1 mV from the down state. C, Overlay of four repetitions of VTA train stimulation to another cell. VTA stimulation depolarized the membrane to a relatively consistent level regardless of whether the cell was in the up or down state at the time of stimulation. The average amplitude of the response in this cell was 20.0 mV over all of the repetitions, and 25.2 mV from the down state. The average time to decay to one-half amplitude was 923 msec (thin arrow), and the duration to return to baseline was 1532 msec (thick arrow). D, After the termination of this sustained depolarization, most cells were observed to return to spontaneous membrane potential shifts (arrow, onset of a transition to an up state).
Figure 3.
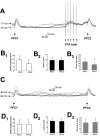
VTA train stimulation reduced the amplitude of PFC-evoked EPSPs. A, Overlay of five traces from one cell illustrating stimulation with the combined protocol as described in Materials and Methods. In this neuron, train stimulation of the VTA (5 pulses; 1.0 mA; 20 Hz) was initiated 900 msec after PFC1 (0.8 mA), and PFC2 (0.8 mA) was delivered 200 msec after the last pulse of the VTA train. The amplitude of the response to PFC2 in this cell averaged 82.5% of the response to PFC1 over all of the repetitions. B, Summary of results from all 48 cells (mean + SD) showing a significant reduction in EPSP amplitude (B1), a lack of effect on onset latencies (B2), and a significant reduction in decay to one-half amplitude (B3) of PFC-elicited EPSPs after VTA train stimulation. Error bars in B and D represent SDs from the mean. C, Traces from the same neuron as in A illustrating that PFC EPSP amplitude was not reduced in the absence of VTA train stimulation. Five traces from this cell are overlaid. The PFC2 pulse stimulation (0.8 mA) was delivered 1300 msec after PFC1 (0.8 mA). The amplitude of the EPSP in response to PFC2 averaged 91% of the response to PFC1 in this cell. D, Summary of results from all nine cells, illustrating that EPSP amplitude (D1), onset latency (D2), and decay time (D3) were unchanged over time in the absence of VTA stimulation. *p < 0.001.
Figure 4.
PFC-evoked EPSPs after VTA train stimulation were also attenuated when selectively compared with EPSPs elicited during spontaneous up states. A, Overlay of four traces illustrating that PFC stimulation (PFC1) (1.0 mA) delivered during a spontaneous up state (indicated by arrow and dashed line) evoked an EPSP with a larger amplitude than PFC stimulation delivered after VTA train stimulation (PFC2) (1.0 mA). In this cell, the amplitude of the response to PFC2 averaged 59% of the response to PFC1. B, Summary of comparisons between PFC1 in up states and PFC2 after VTA stimulation in 26 cells showing that EPSP amplitude (B1) was significantly attenuated despite comparable levels of membrane depolarization. Onset latencies (B2) were unaffected, whereas decay to one-half amplitude times (B3) were also significantly reduced after VTA stimulation compared with EPSPs evoked during up states. *p < 0.05. Error bars represent SDs from the mean.
Figure 5.
Injection of positive current through the recording electrode did not affect the amplitude of PFC-elicited EPSPs in accumbens neurons. A, Overlay illustrating typical responses (4 traces) to the combined stimulation protocol in which positive current injection was substituted for VTA train stimulation. In this neuron, the PFC1 pulse stimulation (1.0 mA) was followed 950 msec later by injection of a 0.07 nA depolarizing current for 500 msec. PFC2 pulse stimulation (1.0 mA) was delivered 350 msec after the initiation of positive current injection. Arrows indicate the mean resting potential and level of membrane depolarization evoked by current injection over all 10 repetitions. EPSP amplitude in response to PFC2 averaged 88% of EPSP amplitude in response to PFC1 in this cell. B, Summary of results from eight cells illustrating the lack of attenuation of PFC-evoked EPSP amplitude (B1) or onset latencies (B2) after artificial membrane depolarization by intracellular current injection. In contrast to the effects of VTA stimulation, injection of depolarizing current significantly lengthened the decay time of PFC-elicited EPSPs (B3). *p < 0.05. Error bars represent SDs from the mean.
Figure 6.
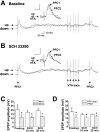
Systemic administration of the D1 antagonist SCH 23390 (0.5 mg/kg, i.p.) did not alter the attenuation of PFC-evoked responses after VTA train stimulation. A, Overlay of two traces from the up and down states of one cell illustrating the baseline (predrug) response to combined PFC (1.0 mA) and VTA train stimulation. Over all of the repetitions, the amplitude of the response to PFC2 in this cell averaged 72.6% of the response to PFC1. Inset, Detail of the EPSPs evoked by the first PFC stimulation (PFC1; black) during a spontaneous up state and the second PFC stimulation (PFC2; gray) during the VTA-elicited plateau. The EPSP amplitude in response to PFC2 averaged 86.3% of the PFC1 EPSP amplitude, when PFC1 stimulation occurred during a spontaneous up state. B, Overlay of two traces from the same cell as in A during the second postdrug time period (20 min after SCH 23390 injection). After drug administration, the amplitude of the response to PFC2 averaged 62.8% of the response to PFC1, over all of the repetitions. Inset, Detail of EPSPs as in A, illustrating that, in the presence of SCH 23390, the amplitude of PFC-elicited EPSPs was still decreased by VTA stimulation (PFC2 = 77.5% of PFC1), in comparison with spontaneous up states. Calibration: (in insets) 10 mV, 30 msec. C, Summary of results from all of the cells (n = 4) illustrating that PFC response amplitude remained attenuated after VTA stimulation, across all three predrug and postdrug time points, when all of the stimulation repetitions were analyzed. Labeled time points on the abscissa represent a range of times postdrug (10 min = 10–11 min; 20 min = 19–21 min). Error bars in C and D represent SDs of the mean. D, Summary of results from all of the cells, illustrating the failure of SCH 23390 to block the attenuation of PFC responses when analysis was limited to PFC stimulations occurring during up states. *p < 0.05 (main effect of PFC stimulation) (C, D).
Figure 7.
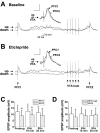
Systemic administration of the D2 antagonist eticlopride (0.5 mg/kg, i.p.) reversed the attenuation of PFC-evoked responses after VTA train stimulation, but only when the comparison was limited to PFC stimulations occurring during spontaneous up states. A, Overlay of two traces from one cell, illustrating the baseline (predrug) response to combined PFC (1.0 mA) and VTA train stimulation. Over all of the repetitions, the amplitude of the response to PFC2 in this cell averaged 70.5% of the response to PFC1. Inset, Detail of the EPSPs as in Figure 6_A_, comparing PFC1 during a spontaneous up state and PFC2 during the VTA-elicited plateau. The EPSP amplitude in response to PFC2 averaged 89.6% of the PFC1 EPSP amplitude, when PFC1 stimulation occurred during a spontaneous up state. B, Overlay of two traces from the same cell as in A during the second postdrug time period (20 min after eticlopride injection). After drug administration, the amplitude of the response to PFC2 averaged 81.9% of the response to PFC1, over all of the repetitions. Inset, Detail of EPSPs as in Figure 6_B_, illustrating that eticlopride blocked the ability of VTA train stimulation to reduce the amplitude of PFC-elicited EPSPs (PFC2 = 122.8% of PFC1), in comparison with spontaneous up states. Calibration: (in insets) 10 mV, 30 msec. C, Summary of results from all of the cells (n = 7), illustrating that PFC response amplitude remained attenuated after VTA stimulation, across all three predrug and postdrug time points, when all of the stimulation repetitions were analyzed. Labeled time points on the abscissa represent a range of times postdrug (10 min = 9–13 min; 20 min = 18–24 min). Error bars in C and D represent SDs from the mean. D, Summary of results from all of the cells illustrating the eticlopride-induced reversal of the attenuation of PFC responses when the analysis was limited to PFC stimulations occurring during up states. *p < 0.04 [main effect of PFC stimulation (C); paired t tests (D)].
Similar articles
- Gating of hippocampal-evoked activity in prefrontal cortical neurons by inputs from the mediodorsal thalamus and ventral tegmental area.
Floresco SB, Grace AA. Floresco SB, et al. J Neurosci. 2003 May 1;23(9):3930-43. doi: 10.1523/JNEUROSCI.23-09-03930.2003. J Neurosci. 2003. PMID: 12736363 Free PMC article. - Differential modulation of anterior cingulate cortical activity by afferents from ventral tegmental area and mediodorsal thalamus.
Onn SP, Wang XB. Onn SP, et al. Eur J Neurosci. 2005 Jun;21(11):2975-92. doi: 10.1111/j.1460-9568.2005.04122.x. Eur J Neurosci. 2005. PMID: 15978009 - Ventral tegmental area neurons in learned appetitive behavior and positive reinforcement.
Fields HL, Hjelmstad GO, Margolis EB, Nicola SM. Fields HL, et al. Annu Rev Neurosci. 2007;30:289-316. doi: 10.1146/annurev.neuro.30.051606.094341. Annu Rev Neurosci. 2007. PMID: 17376009 Review. - Dopaminergic regulation of limbic-striatal interplay.
Floresco SB. Floresco SB. J Psychiatry Neurosci. 2007 Nov;32(6):400-11. J Psychiatry Neurosci. 2007. PMID: 18043763 Free PMC article. Review.
Cited by
- Tales from the dark side: do neuromodulators of drug withdrawal require changes in endocannabinoid tone?
Oleson EB, Cachope R, Fitoussi A, Cheer JF. Oleson EB, et al. Prog Neuropsychopharmacol Biol Psychiatry. 2014 Jul 3;52:17-23. doi: 10.1016/j.pnpbp.2013.07.019. Epub 2013 Aug 1. Prog Neuropsychopharmacol Biol Psychiatry. 2014. PMID: 23911441 Free PMC article. Review. - Opponency revisited: competition and cooperation between dopamine and serotonin.
Boureau YL, Dayan P. Boureau YL, et al. Neuropsychopharmacology. 2011 Jan;36(1):74-97. doi: 10.1038/npp.2010.151. Epub 2010 Sep 29. Neuropsychopharmacology. 2011. PMID: 20881948 Free PMC article. Review. - 'Hot' vs. 'cold' behavioural-cognitive styles: motivational-dopaminergic vs. cognitive-cholinergic processing of a Pavlovian cocaine cue in sign- and goal-tracking rats.
Pitchers KK, Kane LF, Kim Y, Robinson TE, Sarter M. Pitchers KK, et al. Eur J Neurosci. 2017 Dec;46(11):2768-2781. doi: 10.1111/ejn.13741. Epub 2017 Nov 6. Eur J Neurosci. 2017. PMID: 29044780 Free PMC article. - Dopamine tunes prefrontal outputs to orchestrate aversive processing.
Weele CMV, Siciliano CA, Tye KM. Weele CMV, et al. Brain Res. 2019 Jun 15;1713:16-31. doi: 10.1016/j.brainres.2018.11.044. Epub 2018 Dec 1. Brain Res. 2019. PMID: 30513287 Free PMC article. Review. - D2 dopamine modulation of corticoaccumbens synaptic responses changes during adolescence.
Benoit-Marand M, O'Donnell P. Benoit-Marand M, et al. Eur J Neurosci. 2008 Mar;27(6):1364-72. doi: 10.1111/j.1460-9568.2008.06107.x. Epub 2008 Mar 7. Eur J Neurosci. 2008. PMID: 18331340 Free PMC article.
References
- Berridge KC, Robinson TE (1998) What is the role of dopamine in reward: hedonic impact, reward learning, or incentive salience? Brain Res Brain Res Rev 28: 309–369. - PubMed
- Charara A, Grace AA (2003) Dopamine receptor subtypes selectively modulate excitatory afferents from the hippocampus and amygdala to rat nucleus accumbens neurons. Neuropsychopharmacology 28: 1412–1421. - PubMed
- Dalia A, Uretsky NJ, Wallace LJ (1998) Dopaminergic agonists administered into the nucleus accumbens: effects on extracellular glutamate and on locomotor activity. Brain Res 788: 111–117. - PubMed
- DeFrance JF, Sikes RW, Chronister RB (1985) Dopamine action in the nucleus accumbens. J Neurophysiol 54: 1568–1577. - PubMed
Publication types
MeSH terms
Substances
Grants and funding
- F32 DA014821/DA/NIDA NIH HHS/United States
- MH60131/MH/NIMH NIH HHS/United States
- DA14020/DA/NIDA NIH HHS/United States
- R01 DA014020/DA/NIDA NIH HHS/United States
- DA14821/DA/NIDA NIH HHS/United States
- R01 MH060131/MH/NIMH NIH HHS/United States
LinkOut - more resources
Full Text Sources
Miscellaneous
