Sra-1 and Nap1 link Rac to actin assembly driving lamellipodia formation - PubMed (original) (raw)
Sra-1 and Nap1 link Rac to actin assembly driving lamellipodia formation
Anika Steffen et al. EMBO J. 2004.
Abstract
The Rho-GTPase Rac1 stimulates actin remodelling at the cell periphery by relaying signals to Scar/WAVE proteins leading to activation of Arp2/3-mediated actin polymerization. Scar/WAVE proteins do not interact with Rac1 directly, but instead assemble into multiprotein complexes, which was shown to regulate their activity in vitro. However, little information is available on how these complexes function in vivo. Here we show that the specifically Rac1-associated protein-1 (Sra-1) and Nck-associated protein 1 (Nap1) interact with WAVE2 and Abi-1 (e3B1) in resting cells or upon Rac activation. Consistently, Sra-1, Nap1, WAVE2 and Abi-1 translocated to the tips of membrane protrusions after microinjection of constitutively active Rac. Moreover, removal of Sra-1 or Nap1 by RNA interference abrogated the formation of Rac-dependent lamellipodia induced by growth factor stimulation or aluminium fluoride treatment. Finally, microinjection of an activated Rac failed to restore lamellipodia protrusion in cells lacking either protein. Thus, Sra-1 and Nap1 are constitutive and essential components of a WAVE2- and Abi-1-containing complex linking Rac to site-directed actin assembly.
Figures
Figure 1
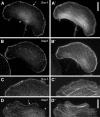
Sra-1 and Nap1 localize at the tips of lamellipodial protrusions. B16-F1 melanoma cells (A–B′) and Swiss 3T3 fibroblasts (C–D′) were immunolabelled for Sra-1 (A, C) or Nap1 (B, D) and counterstained for the actin cytoskeleton with fluorescent phalloidin (A′, B′, C′, D′). Note the localization of both proteins at the very edge (arrows in A, D) of protruding lamellipodia, but the complete absence of these proteins from zones of retraction (asterisk in D) or at the cell rear (asterisk in A). Scale bars in A′ (valid for A–B′) and D′ (valid for C–D′) represent 10 μm.
Figure 2
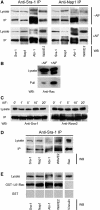
Sra-1 and Nap1 interact with Abi-1 and WAVE2. (A, B) Sra-1 and Nap1 form a complex with Abi-1 and WAVE2. Cellular lysates and precipitates were analysed by Western blotting (WB) with the antibodies as indicated. Polyclonal antibodies raised against Sra-1 (left) as well as Nap1 (right) precipitate a multimolecular complex containing Sra-1, Nap1, Abi-1 and WAVE2, which are not dissociated by the loading of small GTPases with AlF. (A) Upper panel: Precipitates from unstimulated B16-F1 cells are indistinguishable from those (lower panel) of AlF-treated cells. Multiple bands recognized by anti Abi-1 antibodies were described to represent differential phosphorylation products (Biesova et al, 1997). (B) AlF treatment causes increased binding of Rac to the p21-binding domain of PAK (PAK–PBD). (C) Immunoprecipitations with anti-Sra-1 antibodies at different time points after AlF treatment as indicated. Lysates and precipitates were probed with anti-Sra-1 and anti-WAVE antibodies as indicated. Note the co-precipitation of WAVE2 with anti-Sra-1 antibodies at all time points after AlF treatment. (D, E) Rac associates with the intact Nap1/Sra-1/Abi-1/WAVE2 complex. (D) Cellular lysates from B16-F1 cells expressing myc-tagged L61Rac1 were subjected to anti-Sra-1 immunoprecipitation and probed for the presence of Sra-1, Nap1, Abi-1 and WAVE2 as well as for Rac1, which was readily co-precipitated with the intact complex. (E) Immobilized GST–L61Rac, but not GST alone, precipitates Sra-1, Nap1, Abi-1 and WAVE2 from B16-F1 cellular lysates, but not the focal adhesion component Vinculin assayed as negative control.
Figure 3
Sra-1 and Nap1 are redistributed by constitutively active Rac. NIH 3T3 fibroblasts expressing EGFP-tagged Sra-1 (A–B′), Nap1 (C, C′), WAVE2 (E, E′) and actin (F, F′) or EYFP-tagged Abi-1 (D, D′) were analysed by fluorescence and phase contrast video microscopy during microinjection of constitutively active L61Rac1. The panels represent video frames taken 2 min before (A–F) or 30 min after injection (A′–F′). Sra-1 (B, B′) and Nap1 (C, C′) as well as Abi-1 (D, D′) and WAVE2 (E, E′) are translocated to and concentrated at the tips of the lamellipodia induced by active Rac1 (arrows in B′, C′, D′ E′). The phase contrast panels (A, A′) of the Sra-1-expressing cell (B, B′) demonstrate the dramatic morphological change of the cell periphery upon Rac1 injection and the width of the lamellipodium (double-headed arrow in A′) as compared to recruitment of Sra-1/Nap1/Abi-1/WAVE2, which appear to be restricted to the very edge. The organization of lamellipodial microfilaments can best be appreciated with EGFP–actin (F′). The actin bundle (arrowhead in F′) marks the base of the lamellipodium. The scale bar equals 5 μm.
Figure 4
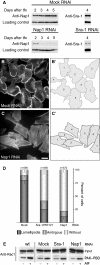
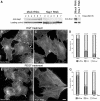
Interference with Sra-1 and Nap1 expression impairs lamellipodia formation in B16-F1 cells. (A) Time course of protein suppression upon siRNA expression. Samples from mock, Nap1 and Sra-1/PIR121 siRNA-treated B16-F1 cells were taken at days after transfection (tfx) as indicated and analysed for Nap1 or Sra-1 protein levels by Western blotting. Note the virtually complete suppression of Nap1 expression at days 3–5 and the significant reduction of Sra-1 at day 4 after transfection. (B–C′). Panels show the actin organization in representative B16-F1 cell populations treated with mock (B) and Nap1 siRNAs (C), respectively. (B′) and (C′) depict the cells quantified from (B) and (C), respectively. Only those cells that were mostly visible within the respective fields were counted and classified (B′, C′). Note the absence of lamellipodia in (C) as opposed to (B). Scale bar equals 20 μm. (D) Results of lamellipodia quantification. Values are means±standard errors of means from three independent experiments. Cells were classified according to the categories (▪) with or (□) without lamellipodia as well as (▪) with ambiguous morphology. Note the correlation between Nap-1 and Sra-1 suppression (A) and reduction of the percentage of cells with lamellipodia (D). (E) Rac expression and activation by AlF is unchanged upon RNAi-mediated knockdown of Sra-1 and Nap1. Wild-type B16-F1 cells as well as mock, Sra-1 or Nap1 siRNA-treated cells express equal amounts of Rac (E, input). In addition, increased amounts of active Rac can be precipitated with PAK–PBD from all lysates upon AlF stimulation (E, PAK–PBD).
Figure 5
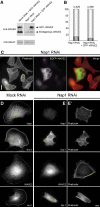
Lamellipodia formation is not restored by ectopic expression of WAVE2 in Nap1 ablated cells. Mock and Nap1 siRNA-treated B16-F1 cells with or without ectopic expression of GFP-tagged WAVE2 were analysed by Western blotting (A) or treated with AlF, fixed, stained and subjected to morphological analysis and quantification as described in Methods (B, C). Nap1 siRNA-treated cells expressing EGFP–WAVE2 were incapable of forming lamellipodia (C), although Western blotting confirmed successful expression of the GFP-tagged full-length WAVE2 protein (A). Note the significant reduction of expression of endogenous WAVE2 in Nap1 siRNA as compared to mock siRNA-treated cells (A). (B) Values are means±standard errors of means from three independent experiments. Cells were classified according to the categories (▪) with or (□) without lamellipodia. Note that ectopic expression of WAVE2 fails to increase the percentage of cells capable of lamellipodia formation (B). Measured differences between Nap1 knockdown populations with or without ectopic EGFP–WAVE expression were statistically not significant (paired _t_-test; _P_=0.11). (D–E′) Downregulation of Nap1 delocalizes Sra-1, WAVE2 and Abi-1. Mock (D) or Nap1 (E, E′) siRNA-treated B16-F1 cells were treated with AlF, fixed and stained with phalloidin (E′) or with antibodies as indicated (E). In contrast to mock-transfected controls (D), Sra-1, WAVE2 and Abi-1 were completely absent from peripheral actin structures of Nap1 siRNA-treated cells (E), which were unable to protrude lamellipodia (E′). Scale bars in (C) and (E′) equal 20 and 10 μm, respectively.
Figure 6
Interference with Sra-1 and Nap1 expression abolishes growth factor-induced membrane ruffling in VA-13 fibroblasts. (A) Evaluation of Nap1 and Sra-1 suppression upon siRNA expression. Samples from VA-13 cells transfected with mock, Nap1 and Sra-1 siRNA vectors were analysed by Western blotting at days 2–7 after transfection (tfx) as indicated. Note the absence of detectable levels of Nap1 expression beyond day 4 and the strong reduction of Sra-1 at day 6 after transfection. EGF and PDGF treatments shown in (B–G) were performed on day 6 after transfection. (B–G) Induction of membrane ruffling by EGF and PDGF. (B, C, E, F) Panels show the actin cytoskeleton of representative cell populations upon mock and Nap1 siRNA and growth factor treatments as indicated. Note the formation of lamellipodia and membrane ruffles (arrows in B, E) in mock-transfected controls induced by EGF and PDGF, respectively, and the absence of this response (C, F) after Nap1 knockdown. (D, G) Scale bar equals 10 μm. (D, G) Quantification of membrane ruffling upon EGF and PDGF treatments. Values are means±standard errors of means from three independent counts. Cells were classified according to the categories (▪) with or (□) without membrane ruffles as well as (▪) with ambiguous morphology. Note the correlation between Nap-1 and Sra-1 suppression (A) and reduction of the percentage of cells capable of membrane ruffling upon growth factor treatments (D, G).
Figure 7
Loss of Sra-1 and Nap1 function abolishes Rac-dependent lamellipodia formation. (A–C) Organization of the actin cytoskeleton upon microinjection with L61Rac1. VA-13 fibroblasts treated as indicated were injected with L61Rac1, fixed and stained with fluorescent phalloidin. Sra-1 or Nap1 siRNA-treated cells (B, C) are completely devoid of lamellipodia upon injections as opposed to the control (A). (D–F′) Sra-1 and Nap1 siRNA-treated cells lack the ability to respond to Rac. The panels show video frames taken from representative examples 2 min before (D–F) or 30 min after injection (D′–F′). Within the 30 min time period after injection, the mock-treated cell has spread significantly (D, D′), while this response is absent in Sra-1 (E, E′) and Nap1 (F, F′) siRNA-treated cells. The success of Rac1 injections was monitored in all experiments by coinjection of fluorescent dextrane as exemplified by the insets in (E′, F′). Scale bar equals 5 μm.
Similar articles
- Abi1 is essential for the formation and activation of a WAVE2 signalling complex.
Innocenti M, Zucconi A, Disanza A, Frittoli E, Areces LB, Steffen A, Stradal TE, Di Fiore PP, Carlier MF, Scita G. Innocenti M, et al. Nat Cell Biol. 2004 Apr;6(4):319-27. doi: 10.1038/ncb1105. Epub 2004 Mar 28. Nat Cell Biol. 2004. PMID: 15048123 - Distinct Interaction Sites of Rac GTPase with WAVE Regulatory Complex Have Non-redundant Functions in Vivo.
Schaks M, Singh SP, Kage F, Thomason P, Klünemann T, Steffen A, Blankenfeldt W, Stradal TE, Insall RH, Rottner K. Schaks M, et al. Curr Biol. 2018 Nov 19;28(22):3674-3684.e6. doi: 10.1016/j.cub.2018.10.002. Epub 2018 Nov 1. Curr Biol. 2018. PMID: 30393033 Free PMC article. - Membrane targeting of WAVE2 is not sufficient for WAVE2-dependent actin polymerization: a role for IRSp53 in mediating the interaction between Rac and WAVE2.
Abou-Kheir W, Isaac B, Yamaguchi H, Cox D. Abou-Kheir W, et al. J Cell Sci. 2008 Feb 1;121(Pt 3):379-90. doi: 10.1242/jcs.010272. Epub 2008 Jan 15. J Cell Sci. 2008. PMID: 18198193 Free PMC article. - Actin polymerization: riding the wave.
Smith LG, Li R. Smith LG, et al. Curr Biol. 2004 Feb 3;14(3):R109-11. Curr Biol. 2004. PMID: 14986640 Review. - [Reorganization of the actin cytoskeleton by WASP family proteins].
Miki H. Miki H. Seikagaku. 2002 Sep;74(9):1149-61. Seikagaku. 2002. PMID: 12402455 Review. Japanese. No abstract available.
Cited by
- Hypoxia activated EGFR signaling induces epithelial to mesenchymal transition (EMT).
Misra A, Pandey C, Sze SK, Thanabalu T. Misra A, et al. PLoS One. 2012;7(11):e49766. doi: 10.1371/journal.pone.0049766. Epub 2012 Nov 21. PLoS One. 2012. PMID: 23185433 Free PMC article. - The WAVE complex associates with sites of saddle membrane curvature.
Pipathsouk A, Brunetti RM, Town JP, Graziano BR, Breuer A, Pellett PA, Marchuk K, Tran NT, Krummel MF, Stamou D, Weiner OD. Pipathsouk A, et al. J Cell Biol. 2021 Aug 2;220(8):e202003086. doi: 10.1083/jcb.202003086. Epub 2021 Jun 7. J Cell Biol. 2021. PMID: 34096975 Free PMC article. - Cytotoxic necrotizing factor-Y boosts Yersinia effector translocation by activating Rac protein.
Wolters M, Boyle EC, Lardong K, Trülzsch K, Steffen A, Rottner K, Ruckdeschel K, Aepfelbacher M. Wolters M, et al. J Biol Chem. 2013 Aug 9;288(32):23543-53. doi: 10.1074/jbc.M112.448662. Epub 2013 Jun 26. J Biol Chem. 2013. PMID: 23803609 Free PMC article. - Regulation of WASP/WAVE proteins: making a long story short.
Bompard G, Caron E. Bompard G, et al. J Cell Biol. 2004 Sep 27;166(7):957-62. doi: 10.1083/jcb.200403127. J Cell Biol. 2004. PMID: 15452139 Free PMC article. Review. - WAVE forms hetero- and homo-oligomeric complexes at integrin junctions in Drosophila visualized by bimolecular fluorescence complementation.
Gohl C, Banovic D, Grevelhörster A, Bogdan S. Gohl C, et al. J Biol Chem. 2010 Dec 17;285(51):40171-9. doi: 10.1074/jbc.M110.139337. Epub 2010 Oct 11. J Biol Chem. 2010. PMID: 20937809 Free PMC article.
References
- Ballestrem C, Wehrle-Haller B, Imhof BA (1998) Actin dynamics in living mammalian cells. J Cell Sci 111 (Part 12): 1649–1658 - PubMed
- Benard V, Bokoch GM (2002) Assay of Cdc42, Rac, and Rho GTPase activation by affinity methods. Methods Enzymol 345: 349–359 - PubMed
- Benesch S, Lommel S, Steffen A, Stradal TE, Scaplehorn N, Way M, Wehland J, Rottner K (2002) Phosphatidylinositol 4,5-biphosphate (PIP2)-induced vesicle movement depends on N-WASP and involves Nck, WIP, and Grb2. J Biol Chem 277: 37771–37776 - PubMed
- Biesova Z, Piccoli C, Wong WT (1997) Isolation and characterization of e3B1, an eps8 binding protein that regulates cell growth. Oncogene 14: 233–241 - PubMed
- Blagg SL, Stewart M, Sambles C, Insall RH (2003) PIR121 regulates pseudopod dynamics and SCAR activity in Dictyostelium. Curr Biol 13: 1480–1487 - PubMed
Publication types
MeSH terms
Substances
LinkOut - more resources
Full Text Sources
Molecular Biology Databases
Research Materials
Miscellaneous
