Quantitation of mitochondrial dynamics by photolabeling of individual organelles shows that mitochondrial fusion is blocked during the Bax activation phase of apoptosis - PubMed (original) (raw)
Quantitation of mitochondrial dynamics by photolabeling of individual organelles shows that mitochondrial fusion is blocked during the Bax activation phase of apoptosis
Mariusz Karbowski et al. J Cell Biol. 2004.
Abstract
A dynamic balance of organelle fusion and fission regulates mitochondrial morphology. During apoptosis this balance is altered, leading to an extensive fragmentation of the mitochondria. Here, we describe a novel assay of mitochondrial dynamics based on confocal imaging of cells expressing a mitochondrial matrix-targeted photoactivable green fluorescent protein that enables detection and quantification of organelle fusion in living cells. Using this assay, we visualize and quantitate mitochondrial fusion rates in healthy and apoptotic cells. During apoptosis, mitochondrial fusion is blocked independently of caspase activation. The block in mitochondrial fusion occurs within the same time range as Bax coalescence on the mitochondria and outer mitochondrial membrane permeabilization, and it may be a consequence of Bax/Bak activation during apoptosis.
Copyright The Rockefeller University Press
Figures
Figure 1.
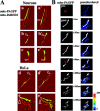
Photoactivation and visualization of mito-PAGFP. HeLa cells (A), primary myocytes (B), and primary hippocampal neurons (C) were cotransfected with mito-DsRED2 (showing the mitochondria processed in Adobe Photoshop with emboss filter) and mito-PAGFP (green). To photoactivate PAGFP, regions marked with white circles (pre) were irradiated with 413-nm light as described in Materials and methods. Mito-PAGFP was imaged using 488-nm laser excitation before (pre) and ∼30 s after (post) the 413-nm light photoactivation. Note the increase in the fluorescence of mito-PAGFP within the vicinity of the photoactivated area.
Figure 2.
Visualization and quantification of mitochondrial fusion using mito-PAGFP. (A) Primary hippocampal neurons (a–c) and HeLa cells (d–e) were cotransfected with mito-DsRED2 (shown processed in Adobe Photoshop with emboss filter) and mito-PAGFP (green). Mito-PAGFP within some of the mitochondria was activated with 413-nm light followed by time-lapse 3D confocal microscopy. Activated and nonactivated mitochondria (arrowheads) are shown 30 s before (a–e) and after (a'–e') mitochondrial fusion and intramitochondrial exchange of matrix contents (visualized by an increase in the amount of activated mito-PAGFP in nonactivated mitochondria). (B) The region indicated by the red circle in a mito-PAGFP–transfected HeLa cell (preactivation) was photoactivated, followed by time-lapse acquisition of images. Between 45 and 50 s the photoactivated mitochondrion divides (arrowheads), followed at 180 s by redistribution of mito-PAGFP from activated to nonactivated mitochondria (arrows,) indicating mitochondrial fusion. To highlight the fluorescence decrease in activated mitochondria and the increase in nonactivated organelles, images were false colored (right). (C) HeLa (a), Cos-7 cells (b), hippocampal neurons (c), WT MEFs (d), and Mfn1−/− MEFs (e) were transfected with mito-PAGFP, followed by photoactivation of one to four ROIs per cell (white circles) and time-lapse confocal acquisition of a series of z-sections covering the entire thickness of the cell as described in Materials and methods. Images shown are pseudocolored projections of z-series. (D) Changes in the fluorescence intensities within activated (red) and nonactivated (black) mitochondria of HeLa (a), Cos-7 (b), hippocampal neurons (c), WT MEFs (d), and Mfn1−/− MEFs (e) were measured over time as described in Materials and methods. Note the small change in fluorescence intensity of activated mito-PAGFP in Mfn1−/− MEFs even 1 h after photoactivation when redistribution of the matrix content greatly decreases fluorescence intensity of mito-PAGFP in other cell types.
Figure 3.
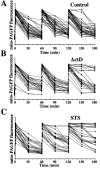
Inhibition of mitochondrial fusion during apoptosis. HeLa cells transfected with mito-PAGFP alone (A–C) or cotransfected with mito-PAGFP and CFP-Bax (D and E) pretreated with 75 μM zVAD-fmk and treated with diluent, DMSO (A), ActD (B and D), or STS (C and E) were analyzed for mitochondrial fusion. Images were collected every 30 min over 180 min after photoactivation at 1, 60, and 120 min. Fluorescence intensity of mito-PAGFP at each time point was measured and plotted against time. (F) Values of percent mito-PAGFP fluorescence decrease after 1, 60, and 120 min in each experimental group were plotted against time. The data represent the mean ± SD of 32–52 single cell time-lapse measurements per group.
Figure 4.
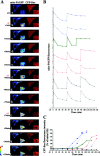
Inhibition of mitochondrial fusion upon mitochondrial activation of Bax. (A) HeLa cells were cotransfected with mito-PAGFP (pseudocolored) and CFP-Bax (red), treated with 75 μM zVAD-fmk, and, after addition of 1 μM STS, followed by the sequential photoactivation of selected regions (a1, a2, and a3) and acquisition of serial images. In the example shown, two sequential photoactivations (b and f) are followed by an efficient fusion and redistribution of mito-PAGFP. After 76 min following the addition of STS (i), when mitochondrial Bax translocation became evident, there was no matrix exchange indicating inhibition of mitochondrial fusion. Insets show magnified mito-PAGFP and CFP-Bax fluorescence within photoactivated area of the cell. (B) Changes in the average fluorescence intensities of mito-PAGFP in representative cells after STS addition and serial photoactivations as in A. (C) Homogeneity of CFP-Bax, reflecting activation and clustering of Bax (see Materials and methods) within cells shown in B, were measured over time and plotted against the time. The same color and pattern lines in B and C were obtained from the same cells. Dynamics of mitochondrial fusion and Bax coalescence of the cell shown in A is depicted by the green lines in B and C. Note correlation of the time of Bax translocation and mitochondrial fusion inhibition in each case.
Figure 5.
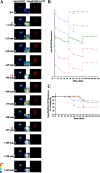
MOMP and inhibition of mitochondrial fusion. (A) HeLa cells were cotransfected with mito-PAGFP (pseudocolored), Smac/DIABLO-CFP (red), and pCDNA-Bax, treated with 75 μM zVAD-fmk, and, after addition of 1 μM STS, followed by sequential photoactivation of selected regions (a1, a2, and a3) and acquisition of serial images. Note the close temporal correlation of MOMP (i) and mitochondrial fusion inhibition. Brightness of the Smac/DIABLO-CFP images in panels i–m has been increased to visualize the release of protein more clearly. Insets show magnified mito-PAGFP fluorescence within the photoactivated area of the cell. (B) Changes in the average fluorescence intensities of mito-PAGFP in different cells after STS addition and serial photoactivations as in A. (C) Increase in homogeneity of Smac/DIABLO-CFP, reflecting release from mitochondria (see Materials and methods) within cells shown in B were measured over time and plotted against the time. The same color and pattern lines in B and C were obtained from the same cells. The cell shown in A is depicted by the green lines in B and C.
Similar articles
- Mitochondrial membrane permeabilization is a critical step of lysosome-initiated apoptosis induced by hydroxychloroquine.
Boya P, Gonzalez-Polo RA, Poncet D, Andreau K, Vieira HL, Roumier T, Perfettini JL, Kroemer G. Boya P, et al. Oncogene. 2003 Jun 19;22(25):3927-36. doi: 10.1038/sj.onc.1206622. Oncogene. 2003. PMID: 12813466 - Biphasic translocation of Bax to mitochondria.
Capano M, Crompton M. Capano M, et al. Biochem J. 2002 Oct 1;367(Pt 1):169-78. doi: 10.1042/BJ20020805. Biochem J. 2002. PMID: 12097139 Free PMC article. - Smac induces cytochrome c release and apoptosis independently from Bax/Bcl-x(L) in a strictly caspase-3-dependent manner in human carcinoma cells.
Hasenjäger A, Gillissen B, Müller A, Normand G, Hemmati PG, Schuler M, Dörken B, Daniel PT. Hasenjäger A, et al. Oncogene. 2004 Jun 3;23(26):4523-35. doi: 10.1038/sj.onc.1207594. Oncogene. 2004. PMID: 15064710 - Mitochondria on guard: role of mitochondrial fusion and fission in the regulation of apoptosis.
Karbowski M. Karbowski M. Adv Exp Med Biol. 2010;687:131-42. doi: 10.1007/978-1-4419-6706-0_8. Adv Exp Med Biol. 2010. PMID: 20919642 Review. - [The role of mitochondrial dynamics in cell death].
Orlova DD, Tribulovich VG, Garabadzhiu AV, Barlev NA, Martin S. Orlova DD, et al. Tsitologiia. 2015;57(3):184-91. Tsitologiia. 2015. PMID: 26021167 Review. Russian.
Cited by
- Too much death can kill you: inhibiting intrinsic apoptosis to treat disease.
Li K, van Delft MF, Dewson G. Li K, et al. EMBO J. 2021 Jul 15;40(14):e107341. doi: 10.15252/embj.2020107341. Epub 2021 May 26. EMBO J. 2021. PMID: 34037273 Free PMC article. Review. - Mitophagy receptor FUNDC1 regulates mitochondrial dynamics and mitophagy.
Chen M, Chen Z, Wang Y, Tan Z, Zhu C, Li Y, Han Z, Chen L, Gao R, Liu L, Chen Q. Chen M, et al. Autophagy. 2016;12(4):689-702. doi: 10.1080/15548627.2016.1151580. Autophagy. 2016. PMID: 27050458 Free PMC article. - Single cell analysis reveals the involvement of the long non-coding RNA Pvt1 in the modulation of muscle atrophy and mitochondrial network.
Alessio E, Buson L, Chemello F, Peggion C, Grespi F, Martini P, Massimino ML, Pacchioni B, Millino C, Romualdi C, Bertoli A, Scorrano L, Lanfranchi G, Cagnin S. Alessio E, et al. Nucleic Acids Res. 2019 Feb 28;47(4):1653-1670. doi: 10.1093/nar/gkz007. Nucleic Acids Res. 2019. PMID: 30649422 Free PMC article. - Linking fatty acid stress to beta-cell mitochondrial dynamics.
Wiederkehr A, Wollheim CB. Wiederkehr A, et al. Diabetes. 2009 Oct;58(10):2185-6. doi: 10.2337/db09-0967. Diabetes. 2009. PMID: 19794075 Free PMC article. No abstract available. - Effects of overexpression of huntingtin proteins on mitochondrial integrity.
Wang H, Lim PJ, Karbowski M, Monteiro MJ. Wang H, et al. Hum Mol Genet. 2009 Feb 15;18(4):737-52. doi: 10.1093/hmg/ddn404. Epub 2008 Nov 27. Hum Mol Genet. 2009. PMID: 19039036 Free PMC article.
References
- Frank, S., B. Gaume, E.S. Bergmann-Leitner, W.W. Leitner, E.G. Robert, F. Catez, C.L. Smith, and R.J. Youle. 2001. The role of dynamin-related protein 1, a mediator of mitochondrial fission, in apoptosis. Dev. Cell. 1:515–525. - PubMed
- Hsu, Y.T., and R.J. Youle. 1998. Bax in murine thymus is a soluble monomeric protein that displays differential detergent-induced conformations. J. Biol. Chem. 273:10777–10783. - PubMed
- Ishihara, N., A. Jofuku, Y. Eura, and K. Mihara. 2003. Regulation of mitochondrial morphology by membrane potential, and DRP1-dependent division and FZO1-dependent fusion reaction in mammalian cells. Biochem. Biophys. Res. Commun. 301:891–898. - PubMed
MeSH terms
Substances
LinkOut - more resources
Full Text Sources
Other Literature Sources
Molecular Biology Databases
Research Materials


