Postsynaptic calcium influx at single synaptic contacts between pyramidal neurons and bitufted interneurons in layer 2/3 of rat neocortex is enhanced by backpropagating action potentials - PubMed (original) (raw)
Postsynaptic calcium influx at single synaptic contacts between pyramidal neurons and bitufted interneurons in layer 2/3 of rat neocortex is enhanced by backpropagating action potentials
Katharina M M Kaiser et al. J Neurosci. 2004.
Abstract
Pyramidal neurons in layer 2/3 (L2/3) of the rat somatosensory cortex excite somatostatin-positive inhibitory bitufted interneurons located in the same cortical layer via glutamatergic synapses. A rise in volume-averaged dendritic [Ca2+]i evoked by backpropagating action potentials (APs) reduces glutamatergic excitation via a retrograde signal, presumably dendritic GABA. To measure the rise in local [Ca2+]i at synaptic contacts during suprathreshold excitation, we identified single synaptic contacts in the acute slice preparation in pairs of pyramidal and bitufted cells each loaded with a Ca2+ indicator dye. Repetitive APs (10-15 APs at 50 Hz) evoked in a L2/3 pyramidal neuron gave rise to facilitating unitary EPSPs in the bitufted cell. Subthreshold EPSPs evoked a transient rise in [Ca2+]i of 80-250 nM peak amplitude at the postsynaptic dendritic site. The local postsynaptic [Ca2+]i transient was restricted to 10 microm of dendritic length, lasted for 200 msec, and was mediated predominantly by NMDA receptor channels. When EPSPs were suprathreshold, the evoked AP backpropagated into the apical and basal dendritic arbor and increased the local [Ca2+]i transient at active contacts by approximately twofold, with a peak amplitude reaching 130-450 nM. This value is in the range of the half-maximal dendritic [Ca2+]i, evoking retrograde inhibition of glutamate release from boutons of pyramids. The localized enhancement of dendritic Ca2+ influx at synaptic contacts by synaptically evoked backpropagating APs could represent one mechanism by which a retrograde signal can limit the excitation of bitufted interneurons by L2/3 pyramids when these are repetitively active.
Figures
Figure 5.
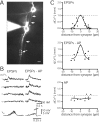
Presynaptic and postsynaptic Ca2+ influx at single synaptic contacts recorded by using two-photon excitation fluorescence microscopy. A, top, Fluorescence image of a pyramid-to-bitufted cell pair filled with rhod-2 and OGB-1, respectively. The pyramidal neuron is shown in red, the interneuron in green. The region with an identified synaptic contact is marked by the rectangle and shown at higher magnification at the bottom. The arrowhead points to a synaptic contact. The presynaptic axon is hardly visible, but lightens up during Ca2+ influx (see B). Line scans shown in B were performed at the region indicated by the white vertical line. B, Fluorescence line scans recorded during unitary synaptic stimulation on the presynaptic bouton (red) and the postsynaptic dendrite (green). In the pyramidal neuron three APs were evoked at 10 Hz (see C). C, Each of the three APs evoked in the pyramidal neuron gave rise to a Ca2+ influx into the presynaptic terminal (top traces, same experiment shown in B). The postsynaptic neuron responded with two EPSPs, but only during one was a postsynaptic Ca2+ signal also measured (lower traces). Presumably, the second EPSP was evoked at another contact. Fluorescence data were not filtered. Note: No Ca2+ transient was recorded on the other dendrite also covered by the line scan (see B), indicating the synaptic origin of the Ca2+ signals.
Figure 1.
Neurolucida reconstruction and identification of synaptic contacts formed between L2/3 pyramidal and bitufted neuron. A, The somatodendritic domain of the presynaptic pyramidal neuron of a pyramid-to-bitufted cell pair is shown in red and the axon arbor in blue. The main axon descends toward the white matter while giving rise to several long horizontal collaterals in L2/3-L5. The soma and dendritic arbor of the postsynaptic bitufted interneuron innervated by the pyramidal neuron are drawn in black and the axon arbor in green. Note the two axonal domains of the bitufted interneuron: a dense projection confined to supragranular L2/3 and L1 and a vertically oriented, descending projection spanning L2/3-L6. Scale bar, 300 μm. B, Superposition of part of the pyramidal cell axonal arbor (blue) and the somatodendritic domain of the bitufted interneuron (black) at higher magnification. Blue dots indicate four putative synaptic contacts established by axon collaterals of the pyramidal cell on bitufted neuron dendrites. Note that all synaptic contacts in this cell pair were established within 100 μm from the soma of the bitufted interneuron. Scale bar, 100 μm. C, Photomicrographs of putative synaptic contacts, numbers correspond to those in B. Synaptic contacts were established on dendritic shafts (1, 2) or dendritic spines (3, 4), but not on the soma. Black arrows point to the putative synaptic contacts identified light microscopically; white arrowheads indicate the en passant axon. Scale bar, 10 μm.
Figure 2.
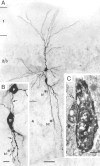
Morphology of pyramidal-to-bitufted cell connection in L2/3. A, Low-power photomontage of the somatodendritic morphology of the presynaptic pyramidal cell (upper cell body) and the postsynaptic interneuron (lower cell body). Asterisks (marked as b1 and b2) indicate two, putative synaptic contacts identified on light microscopy between pyramidal cell axon and dendrites of the bitufted cell. Scale bar, 50 μm. B, Higher magnification of the somatodendritic region showing synaptic contact b1 (asterisk). Arrows mark the descending axon of the pyramidal neuron (P) that established a synaptic contact on a secondary dendrite of the bitufted interneuron (B). Scale bar, 10 μm. C, Electron microscopic image of synaptic contact (b1) established on the dendritic shaft (d) of the bitufted interneuron as shown on light microscopy in B. Arrows point to the synaptic cleft. Scale bar, 0.2 μm.
Figure 3.
Dendritic Ca2+ influx evoked by subthreshold and suprathreshold EPSPs during unitary synaptic stimulation. A, A train of 15 APs (at 50 Hz) was evoked in a pyramidal neuron by current injection via a somatic pipette (upper traces). This train elicited subthreshold and suprathreshold EPSPs in a postsynaptic bitufted interneuron (lower traces). Note the larger scale bar for subthreshold EPSPs. Resting potentials were -75 mV for the pyramidal cell and -59 mV for the interneuron. B, Fluorescence image of a bitufted neuron filled via the somatic pipette with 250 μ
m
fura-2. Selected regions for Ca2+ fluorescence imaging, located on dendrites are marked by rectangles and numbered 1-13. Corresponding [Ca2+]i transients evoked by suprathreshold EPSPs-APs in the bitufted neuron are shown on the right. The presynaptic pyramidal neuron, which was not loaded with dye, was stimulated to generate a train of 10 APs at 50 Hz. At all locations the sequence EPSPs-APs evoked a transient rise in dendritic [Ca2+]i. Note the differences in the amplitude of Ca2+ signals. Fluorescence traces are averages of five sweeps. Scale bar, 10 μm. C, Two classes of dendritic [Ca2+]i transients. Fluorescence image of a bitufted neuron with two dendritic sites selected for Ca2+ imaging (left) and corresponding [Ca2+]i transients during subthreshold and suprathreshold EPSPs (right). Region 1 showed Ca2+ influx during subthreshold and suprathreshold EPSPs (upper traces), whereas region 2 showed Ca2+ influx only during suprathreshold EPSPs. Stimulation of the presynaptic pyramidal neuron, which is not visible, was evoked with 10 APs (50 Hz). Traces are single sweeps without smoothing. Scale bar, 10 μm.
Figure 4.
Identification of single synaptic contacts between pyramidal and bitufted cell by fluorescence and Ca2+ imaging. A, Pseudocolor fluorescence image of synaptically connected pyramidal (yellow) and bitufted (blue) neuron. The presynaptic pyramidal cell was loaded with 400 μ
m
mag-fura-2 for visualization. The postsynaptic bitufted neuron was filled with 250 μ
m
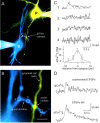
fura-2 for Ca2+ imaging. Rectangles mark selected dendritic regions for Ca2+ imaging. B, Higher magnification of the intersection between an axon collateral of the pyramidal neuron and a dendritic branch of the bitufted interneuron shown in A. Scale bar, 5 μm. C, Amplitude of [Ca2+]i transients evoked by subthreshold EPSPs in the bitufted neuron dendrite at a single active synaptic contact and adjacent dendritic regions (top graphs). Numbers refer to regions shown in A and B. Stimulation of the presynaptic pyramidal neuron evoked a train of 10 APs (50 Hz). The bottom graph shows the distribution of [Ca2+]i transient peak amplitudes at and around the synaptic contact. The data points were fitted by a Gaussian with a half-width of 5 μm. D, Difference in [Ca2+]i transients at an active synaptic contact after subthreshold and suprathreshold EPSPs. In the presynaptic pyramidal neuron, 15 APs at 50 Hz were initiated. Data are taken from the cell pair shown in Figure 9_A_. For postsynaptic membrane potentials see Figure 9_B_ (bottom traces).
Figure 6.
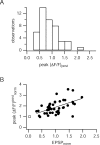
Postsynaptic Ca2+ transients at single contacts. A, Histogram of postsynaptic peak Δ_F_/F evoked by single EPSPs. The mean peak Δ_F_/F was 0.89 ± 0.40 (n = 45 single sweeps). Data are pooled from three synaptic contacts of three pairs. B, Postsynaptic peak Δ_F_/F increases with EPSP size (filled circles) (regression r = 0.54). Data are pooled from n = 45 EPSP-evoked postsynaptic Ca2+ transients from three synaptic contacts of three cell pairs. Peak fluorescence amplitudes and EPSPs were normalized to mean values for each cell pair. For comparison also, the peak Δ_F_/F evoked by a single backpropagating AP at the synaptic contact is shown (rectangle, placed arbitrarily).
Figure 7.
Postsynaptic Ca2+ diffusion. A, Fluorescence image of a dendrite of a bitufted neuron receiving input from a pyramidal neuron (same cell pair shown in Fig. 5). The arrowhead points to an identified synaptic contact. The vertical lines indicate the regions for line scans on the synaptic contact (top) and 2.7 μm apart (bottom). B, Diffusion of Ca2+ away from the point of entry along the dendrite. Presynaptic and postsynaptic Δ_F_/F transients recorded at the contact (left) and 2.7 μm away (right). Fifteen APs at 50 Hz were evoked in the pyramidal neuron. Fluorescence traces are averages of three to five sweeps.
Figure 8.
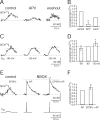
Ion channels mediating dendritic Ca2+ influx. A, Ca2+ influx at a synaptic contact evoked by a train of 15 presynaptic APs in control conditions (left), during application of 100 μ
m
APV (middle), and after washout (right). Traces are averages of six, six, and nine sweeps, respectively. The interneuron was voltage-clamped at -60 mV. B, Pooled data of normalized peak [Ca2+]i amplitudes in control and after bath application of APV were significantly different (two-tailed paired t test; *p < 0.026). Data are taken from n = 5 cell pairs (washout from two cell pairs). C, Ca2+ influx at a synaptic contact evoked by a train of 15 presynaptic APs when the soma of the bitufted neuron was voltage-clamped at -90 (left), -60 (middle), and -50 mV (right). Traces are averages of two, three, and three sweeps, respectively. D, Pooled data of normalized peak [Ca2+]i amplitudes at different holding potentials. Data are from 11 pairs. The increase of [Ca2+]i amplitudes at -50 mV compared with -60 and -90 mV was significant (two-tailed paired t test; *p < 0.05 and *p < 0.01, respectively). E, Ca2+ influx at a synaptic contact evoked by a train of 15 presynaptic APs in control condition (left). After the application of 10 μ
m
NBQX, the [Ca2+]i amplitude evoked by a single, somatically evoked backpropagating AP (middle) was increased significantly when combined with synaptic stimulation (right) (t test; **p < 0.001). Traces are averages of 4, 24, and 25 sweeps, respectively. F, Pooled data for normalized peak [Ca2+]i amplitudes. Data are from three pairs. The increase of [Ca2+]i amplitude was significant (t test; *p < 0.025).
Figure 9.
Spatial profile of dendritic [Ca2+] transients at single synaptic contacts. A, Fluorescence image of a synaptically connected pyramidal and bitufted neuron cell pair. The bitufted neuron was loaded with 250 μ
m
fura-2, and the pyramidal cell with 400 μ
m
mag-fura-2. Arrows point to the axon of the pyramidal cell, which established a contact with a dendrite of the bitufted neuron (rectangle 1). Rectangles mark four dendritic regions of the bitufted neuron, which were selected for Ca2+ imaging. Region 1 corresponds to the intersection of an axon collateral of the pyramidal cell and a branch of a basal dendrite of the bitufted cell. Scale bar, 10 μm. B, Ca2+ transients evoked by subthreshold (left) and suprathreshold (right) EPSPs at the regions shown in A. Numbers refer to those in A. In the presynaptic pyramidal neuron a train of 15 APs at 50 Hz (bars on top traces) was evoked. Postsynaptic membrane potentials are shown on the bottom (note the different time scale). The AP (right) is truncated. C, Normalized peak Ca2+ amplitudes evoked by EPSPs remaining subthreshold (top) or being suprathreshold (middle). Data represent measurements from seven synaptic contacts and 18 adjacent dendritic regions in seven cell pairs (top) and from four of the seven synaptic contacts and nine adjacent dendritic regions (middle). For comparison, the bottom graph shows normalized peak [Ca2+]i amplitudes evoked by a single backpropagating AP evoked by somatic current injection into bitufted neurons at 5 synaptic contacts of the 7 pairs, and 12 nearby dendritic regions. Amplitudes were normalized to those evoked by subthreshold EPSPs at the identified synaptic contacts (dotted lines; average [Ca2+]i amplitude, 43 ± 15 n
m
; n = 7). Data points were fitted with Gaussians (solid lines). Amplitudes evoked by suprathreshold EPSPs (middle) and a single backpropagating AP (bottom) were normalized to mean values of EPSPs-evoked [Ca2+]i amplitudes at the synaptic contacts, respectively.
Figure 10.
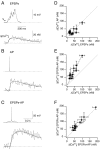
Summation of dendritic Ca2+ influx at single synaptic contacts. A-C, Summation of Ca2+ influx evoked by subthreshold EPSPs and by a backpropagating AP recorded at the same synaptic contact. Shown are the mean responses to subthreshold EPSPs (A), to a single backpropagating AP (B) and to suprathreshold EPSPs (EPSPs-APs) (C). The bitufted neuron was loaded with 250 μ
m
fura-2. The resting potential was -59 mV. D-F, Average peak [Ca2+]i amplitudes measured at identified synapses (11 pairs) in response to the different types of stimulation shown in A-C. In each experiment the amplitudes of [Ca2+]i transients were largest for the stimulus that evoked suprathreshold EPSPs (EPSPs-APs). The graph in F indicates that the peak [Ca2+]i amplitude evoked by suprathreshold EPSPs is slightly, but significantly (t test; p < 0.002) larger than the arithmetic sum of [Ca2+]i transients evoked by EPSPs or a single backpropagating AP alone.
Similar articles
- Back-propagating action potentials mediate calcium signalling in dendrites of bitufted interneurons in layer 2/3 of rat somatosensory cortex.
Kaiser KM, Zilberter Y, Sakmann B. Kaiser KM, et al. J Physiol. 2001 Aug 15;535(Pt 1):17-31. doi: 10.1111/j.1469-7793.2001.t01-1-00017.x. J Physiol. 2001. PMID: 11507155 Free PMC article. - Dendritic GABA release depresses excitatory transmission between layer 2/3 pyramidal and bitufted neurons in rat neocortex.
Zilberter Y, Kaiser KM, Sakmann B. Zilberter Y, et al. Neuron. 1999 Dec;24(4):979-88. doi: 10.1016/s0896-6273(00)81044-2. Neuron. 1999. PMID: 10624960 - Calcium dynamics associated with action potentials in single nerve terminals of pyramidal cells in layer 2/3 of the young rat neocortex.
Koester HJ, Sakmann B. Koester HJ, et al. J Physiol. 2000 Dec 15;529 Pt 3(Pt 3):625-46. doi: 10.1111/j.1469-7793.2000.00625.x. J Physiol. 2000. PMID: 11118494 Free PMC article. - Neocortical inhibitory system.
Druga R. Druga R. Folia Biol (Praha). 2009;55(6):201-17. Folia Biol (Praha). 2009. PMID: 20163769 Review. - Regulation of synaptic signalling by postsynaptic, non-glutamate receptor ion channels.
Bloodgood BL, Sabatini BL. Bloodgood BL, et al. J Physiol. 2008 Mar 15;586(6):1475-80. doi: 10.1113/jphysiol.2007.148353. Epub 2007 Dec 20. J Physiol. 2008. PMID: 18096597 Free PMC article. Review.
Cited by
- Cholinergic induction of input-specific late-phase LTP via localized Ca2+ release in the visual cortex.
Cho KH, Jang HJ, Jo YH, Singer W, Rhie DJ. Cho KH, et al. J Neurosci. 2012 Mar 28;32(13):4520-30. doi: 10.1523/JNEUROSCI.4577-11.2012. J Neurosci. 2012. PMID: 22457499 Free PMC article. - Calcium indicator loading of neurons using single-cell electroporation.
Nevian T, Helmchen F. Nevian T, et al. Pflugers Arch. 2007 Jul;454(4):675-88. doi: 10.1007/s00424-007-0234-2. Epub 2007 Mar 2. Pflugers Arch. 2007. PMID: 17334778 - Synaptic Plasticity in Cortical Inhibitory Neurons: What Mechanisms May Help to Balance Synaptic Weight Changes?
Bannon NM, Chistiakova M, Volgushev M. Bannon NM, et al. Front Cell Neurosci. 2020 Sep 4;14:204. doi: 10.3389/fncel.2020.00204. eCollection 2020. Front Cell Neurosci. 2020. PMID: 33100968 Free PMC article. Review. - Differential regulation of metabotropic glutamate receptor- and AMPA receptor-mediated dendritic Ca2+ signals by presynaptic and postsynaptic activity in hippocampal interneurons.
Topolnik L, Congar P, Lacaille JC. Topolnik L, et al. J Neurosci. 2005 Jan 26;25(4):990-1001. doi: 10.1523/JNEUROSCI.4388-04.2005. J Neurosci. 2005. PMID: 15673681 Free PMC article. - Active Dendrites and Differential Distribution of Calcium Channels Enable Functional Compartmentalization of Golgi Cells.
Rudolph S, Hull C, Regehr WG. Rudolph S, et al. J Neurosci. 2015 Nov 25;35(47):15492-504. doi: 10.1523/JNEUROSCI.3132-15.2015. J Neurosci. 2015. PMID: 26609148 Free PMC article.
References
- Bollmann JH, Sakmann B, Borst JG (2000) Calcium sensitivity of glutamate release in a calyx-type terminal. Science 289: 953-957. - PubMed
- Cobb SR, Buhl EH, Halasy K, Paulsen O, Somogyi P (1995) Synchronization of neuronal activity in hippocampus by individual GABAergic interneurons. Nature 378: 75-78. - PubMed
- DeFelipe J, Farinas I (1992) The pyramidal neuron of the cerebral cortex: morphological and chemical characteristics of the synaptic inputs. Prog Neurobiol 39: 563-607. - PubMed
- Denk W, Strickler JH, Webb WW (1990) Two-photon laser scanning fluorescence microscopy. Science 248: 73-76. - PubMed
MeSH terms
Substances
LinkOut - more resources
Full Text Sources
Miscellaneous


