Diversity of functional astroglial properties in the respiratory network - PubMed (original) (raw)
Diversity of functional astroglial properties in the respiratory network
Dennis Grass et al. J Neurosci. 2004.
Abstract
A population of neurons in the caudal medulla generates the rhythmic activity underlying breathing movements. Although this neuronal network has attracted great attention for studying neuronal aspects of synaptic transmission, functions of glial cells supporting this neuronal activity remain unclear. To investigate the role of astrocytes in the respiratory network, we applied electrophysiological and immunohistochemical techniques to characterize astrocytes in regions involved in the generation and transmission of rhythmic activity. In the ventral respiratory group and the hypoglossal nucleus (XII) of acutely isolated brainstem slices, we analyzed fluorescently labeled astrocytes obtained from TgN(GFAP-EGFP) transgenic mice with the whole-cell voltage-clamp technique. Three subpopulations of astrocytes could be discerned by their distinct membrane current profiles. A first group of astrocytes was characterized by nonrectifying, symmetrical and voltage-independent potassium currents and a robust glutamate transporter response to d-aspartate. A second group of astrocytes showed additional A-type potassium currents, whereas a third group, identified by immunolabeling for the glial progenitor marker NG2, expressed outwardly rectifying potassium currents, smaller potassium inward currents, and only minimal D-aspartate-induced transporter currents. Astrocytes of all groups showed kainate-induced inward currents. We conclude that most of the astrocytes serve as a buffer system of excess extracellular glutamate and potassium; however, a distinct cell population (NG2-positive, A-type potassium currents) may play an important role for network plasticity.
Figures
Figure 2.
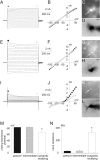
Different _I_-V relations of astrocytes in the ventral respiratory group. _A_-D, Whole-cell voltage-clamp recordings (A), _I_-V curve (B), and corresponding CCD camera images (C, D) from a passive astrocyte in the ventral respiratory group. _E_-L, Corresponding data from an intermediate cell (E-H) and from an outwardly rectifying cell (I-L). CCD images in C, G, and K represent EGFP fluorescence; images in D, H, and L represent Alexa Fluor 568 filling of the cells in C, G, and K, respectively. _A_-L, Whole-cell membrane currents were recorded by stepping the holding potential from -150 to +50 mV (10 mV increments) starting at a holding potential of -80 mV. For _I_-V relations, current amplitudes at the beginning (closed symbols) and at the end of the voltage pulses (open symbols) were plotted against the holding potential. M,N, Resting membrane potential(M) and input resistance (N) in different astrocytes as distinguished in _A_-L (data are given as mean ± SE; *p < 0.05). Scale bars, 20 μm.
Figure 3.
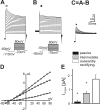
Expression of A-type K+ currents in astrocytes of the ventral respiratory group. _A_-D, Whole-cell voltage-clamp recordings in an intermediate astrocyte from the ventral respiratory group exposed to voltage pulses from -70 to +80 mV for 400 msec after prepulses to -110 mV (A, open circles in D) and -50 mV (B, filled circles in D). Point-by-point subtraction of the two recordings reveals the isolated transient current, which has the properties of an A-type K+ current (C). D, Calculated A-type currents (black triangles) determined 10 msec after the beginning of the voltage pulses are plotted against membrane potential. _I_-V curves show an activation potential of the K+ channels at -40 mV that is characteristic for A-type current. E, Amplitudes of A-type K+ currents derived from subtraction protocol (at +70 mV) in different types of astrocytes (data are given as mean ± SE).
Figure 1.
Different expression levels of EGFP fluorescence in astrocytes in the ventral respiratory group. A, B, Maximum-intensity projections of stacks of images recorded by confocal laser scanning microscopy from EGFP-expressing astrocytes in the ventral respiratory group(A) and the hypoglossal nucleus (B). In both regions, weakly fluorescent astrocytes (arrowheads) appear to have fewer processes than brightly stained cells (arrows). To visualize process extension more precisely, cells were filled during patch-clamp recording with a red fluorescent dye (Alexa Fluor 568), and confocal images were recorded after fixation. _C_-E, Filling of a highly fluorescing astrocyte with Alexa Fluor 568 revealed a dense process extension of several tens of micrometers (maximum-intensity projection). F, Membrane currents evoked by 100 msec voltage steps from -150 to +70 mV of the highly fluorescent astrocyte filled in _C_-_E. G_-I, Filling of weakly fluorescent astrocytes with Alexa Fluor 568 revealed a similar extension of processes, but the overall density of the processes was smaller. J, Corresponding membrane currents evoked by 100 msec voltage steps from -150 to +70 mV of the astrocyte filled in _G_-I. Scale bars, 20 μm.
Figure 4.
Transporter current expression in different types of astrocytes. _A_-C, Whole-cell voltage-clamp recordings of an intermediate astrocyte from the VRG during application of 1 m
m d
-aspartate. TTX (500 n
m
), CdCl2 (100 μ
m
), and CNQX (50 μ
m
) were added to prevent indirect effects by neighboring neurons. D, Amplitudes of current responses to 1 m
m d
-aspartate in the three types of astrocytes (data are given as mean ± SE).
Figure 5.
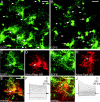
Immunohistochemistry for glial glutamate transporters. The expression of the glial glutamate transporters GLT-1 (_A_-C) and GLAST (_D_-F) is restricted to astrocytes with high expression levels of EGFP. _A_-C, Brainstem slices of P9 TgN(GFAP-EGFP) mice expressing EGFP in astrocytes (A) were stained for GLT-1 (B). As evident from the merged image (C), astrocytes with high EGFP fluorescence (arrows) show overlapping GLT-1 labeling and EGFP fluorescence, whereas astrocytes with lower EGFP expression (arrowheads) do not show any expression of GLT-1. _D_-F, EGFP (D) and GLAST (E) expression in astrocytes. Simultaneous expression (F) of EGFP and GLAST was found in brightly fluorescent astrocytes (arrow); staining for GLAST was not detectable in astrocytes with low EGFP expression (arrowheads). Images are single optical sections of confocal microscopy. Scale bars: (in C, F) _A_-F, 20 μm.
Figure 6.
Effects of local application of kainate. All types of astrocytes responded to direct application of 1 m
m
kainate. _A_-C, Whole-cell voltage-clamp recordings of the three different types of astrocytes in the VRG during application of 1 m
m
kainate for 0.5 sec by pressure pulses; 500 n
m
TTX and 100 μ
m
CdCl2 were added to the bath to exclude indirect effects on recorded astrocytes. D, Amplitudes of current responses to 1 m
m
kainate in different types of astrocytes (n.s. = not significant; data are given as mean ± SE).
Figure 7.
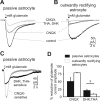
Glutamate-induced inward currents in passive and outwardly rectifying cells. Passive and outwardly rectifying astrocytes show a different sensitivity to glutamate receptor and transporter blockers. A, Current traces elicited by local application of 1 m
m
glutamate in a passive astrocyte under control conditions (500 n
m
TTX, 100 μ
m
CdCl2, 50 μ
m
AP5, 20 μ
m
bicuculline, 20 μ
m
strychnine) after blockade of AMPA receptors with 50 μ
m
CNQX and after additional blockade of glutamate transporters by 300 μ
m
DHK plus 50 μ
m
THA. B, Same experimental protocol in an outwardly rectifying astrocyte. C, Point-by-point subtraction of the recordings depicted in A reveals different kinetics of the DHK-THA-sensitive and CNQX-sensitive currents. D, Reduction of glutamate current induced by receptor (CNQX) and transporter (THA+DHK) blockers in different types of astrocytes (data are given as mean ± SE).
Figure 8.
Immunohistochemistry for NG2, GFAP, and TUC-4. _A_-D, Double immunostaining in brainstem slices of P2 mice expressing EGFP (A), in astrocytes against the proteoglycan NG2 (B), a glial progenitor marker, and GFAP (C) in the ventral respiratory group. The NG2 expression appears to be restricted to astrocytes with low expression levels of EGFP (arrowheads), whereas GFAP expression is limited to astrocytes with high levels of EGFP expression (arrows). D, No overlap of NG2 and GFAP expression was found in astrocytes with low levels of EGFP fluorescence (arrowheads). _E_-M, Double staining for NG2 (F, K) and for the early postmitotic neuronal marker TUC-4 (G, I, L) in the VRG (E-H) and the inferior olive (IO) (_J_-M). I, The expression of TUC-4 was restricted to nonrespiratory regions of the brainstem like the IO and trigeminal nuclei (SP5) but was absent in the ventral respiratory group (I, G). Fluorescence staining for TUC-4 in the overview I is depicted as inverted gray scale image. In the inferior olive, a region with TUC-4 expression (_J_-M, asterisks), no overlap of NG2 and TUC-4 expression was found in astrocytes with low levels of EGFP fluorescence (arrowheads). Images represent single optical sections recorded by confocal microscopy. Scalebars: (in D, H, M) A-H, J-M, 20 μm; I, 200 μm.
Similar articles
- Glycine transporter 1 expression in the ventral respiratory group is restricted to protoplasmic astrocytes.
Szoke K, Härtel K, Grass D, Hirrlinger PG, Hirrlinger J, Hülsmann S. Szoke K, et al. Brain Res. 2006 Nov 13;1119(1):182-9. doi: 10.1016/j.brainres.2006.08.089. Epub 2006 Sep 28. Brain Res. 2006. PMID: 17010320 - Functional Indicators of Glutamate Transport in Single Striatal Astrocytes and the Influence of Kir4.1 in Normal and Huntington Mice.
Dvorzhak A, Vagner T, Kirmse K, Grantyn R. Dvorzhak A, et al. J Neurosci. 2016 May 4;36(18):4959-75. doi: 10.1523/JNEUROSCI.0316-16.2016. J Neurosci. 2016. PMID: 27147650 Free PMC article. - GFAP-expressing cells in the postnatal subventricular zone display a unique glial phenotype intermediate between radial glia and astrocytes.
Liu X, Bolteus AJ, Balkin DM, Henschel O, Bordey A. Liu X, et al. Glia. 2006 Oct;54(5):394-410. doi: 10.1002/glia.20392. Glia. 2006. PMID: 16886203 - Activity-Dependent Plasticity of Astroglial Potassium and Glutamate Clearance.
Cheung G, Sibille J, Zapata J, Rouach N. Cheung G, et al. Neural Plast. 2015;2015:109106. doi: 10.1155/2015/109106. Epub 2015 Aug 4. Neural Plast. 2015. PMID: 26346563 Free PMC article. Review. - Astrocytes of the early postnatal brain.
Felix L, Stephan J, Rose CR. Felix L, et al. Eur J Neurosci. 2021 Sep;54(5):5649-5672. doi: 10.1111/ejn.14780. Epub 2020 May 30. Eur J Neurosci. 2021. PMID: 32406559 Review.
Cited by
- Phenotype overlap in glial cell populations: astroglia, oligodendroglia and NG-2(+) cells.
Alghamdi B, Fern R. Alghamdi B, et al. Front Neuroanat. 2015 May 12;9:49. doi: 10.3389/fnana.2015.00049. eCollection 2015. Front Neuroanat. 2015. PMID: 26106302 Free PMC article. - Fiber optical imaging of astroglial calcium signaling in the respiratory network in the working heart brainstem preparation.
Tacke C, Bischoff AM, Harb A, Vafadari B, Hülsmann S. Tacke C, et al. Front Physiol. 2023 Aug 24;14:1237376. doi: 10.3389/fphys.2023.1237376. eCollection 2023. Front Physiol. 2023. PMID: 37693007 Free PMC article. - Synantocytes: the fifth element.
Butt AM, Hamilton N, Hubbard P, Pugh M, Ibrahim M. Butt AM, et al. J Anat. 2005 Dec;207(6):695-706. doi: 10.1111/j.1469-7580.2005.00458.x. J Anat. 2005. PMID: 16367797 Free PMC article. Review. - Central respiratory chemoreception.
Guyenet PG, Stornetta RL, Bayliss DA. Guyenet PG, et al. J Comp Neurol. 2010 Oct 1;518(19):3883-906. doi: 10.1002/cne.22435. J Comp Neurol. 2010. PMID: 20737591 Free PMC article. Review. - Advances in cellular and integrative control of oxygen homeostasis within the central nervous system.
Ramirez JM, Severs LJ, Ramirez SC, Agosto-Marlin IM. Ramirez JM, et al. J Physiol. 2018 Aug;596(15):3043-3065. doi: 10.1113/JP275890. Epub 2018 Jun 28. J Physiol. 2018. PMID: 29742297 Free PMC article. Review.
References
- Bordey A, Sontheimer H (2000) Ion channel expression by astrocytes in situ: comparison of different CNS regions. Glia 30: 27-38. - PubMed
- Del Negro CA, Morgado-Valle C, Feldman JL (2002) Respiratory rhythm: an emergent network property? Neuron 34: 821-830. - PubMed
Publication types
MeSH terms
Substances
LinkOut - more resources
Full Text Sources
Miscellaneous


