Structure of a flavivirus envelope glycoprotein in its low-pH-induced membrane fusion conformation - PubMed (original) (raw)
Comparative Study
. 2004 Feb 25;23(4):728-38.
doi: 10.1038/sj.emboj.7600064. Epub 2004 Feb 12.
Affiliations
- PMID: 14963486
- PMCID: PMC380989
- DOI: 10.1038/sj.emboj.7600064
Comparative Study
Structure of a flavivirus envelope glycoprotein in its low-pH-induced membrane fusion conformation
Stéphane Bressanelli et al. EMBO J. 2004.
Abstract
Enveloped viruses enter cells via a membrane fusion reaction driven by conformational changes of specific viral envelope proteins. We report here the structure of the ectodomain of the tick-borne encephalitis virus envelope glycoprotein, E, a prototypical class II fusion protein, in its trimeric low-pH-induced conformation. We show that, in the conformational transition, the three domains of the neutral-pH form are maintained but their relative orientation is altered. Similar to the postfusion class I proteins, the subunits rearrange such that the fusion peptide loops cluster at one end of an elongated molecule and the C-terminal segments, connecting to the viral transmembrane region, run along the sides of the trimer pointing toward the fusion peptide loops. Comparison with the low-pH-induced form of the alphavirus class II fusion protein reveals striking differences at the end of the molecule bearing the fusion peptides, suggesting an important conformational effect of the missing membrane connecting segment.
Figures
Figure 1
Structural alignment of the class II membrane fusion proteins TBEV E and SFV E1. The secondary structure, domain nomenclature and color coding follow the definitions used for the TBEV sE dimer (Rey et al, 1995). A color-coded bar below the sequence indicates domains dI, dII, and dIII in red, yellow, and blue, respectively. The fusion peptide loop is colored orange and segments in between domains are purple (the dI/dIII and dIII/stem linkers). Highly conserved residues are given on a green background (note the similar pattern of conservation within the two viruses). A gray semitransparent bar overlays the C-terminal segments that are not part of the crystal structures. The secondary structure elements are indicated above the sequence, with arrows and helices for β-strands and α-helices, respectively. In the stem region, the predicted α-helices (H1, H2, TM1, and TM2) are indicated in gray above the sequence, and only apply to the top TBEV sequence. The corresponding segments in alphaviruses are indicated by s1, s2, and TM below the sequence. The actual transmembrane regions of the proteins are framed in red. The structural alignment was obtained using the DALI server with the three domains separately, using the low-pH-induced trimeric conformation of the two proteins. Structurally equivalent amino acids in the two proteins are boxed. A few important insertions are indicated above the sequence in TBEV E (i1, i2, and i3, in pale red) and below for SFV E1 (i1′ and i2′, in dark green). The insertion in between residues 204 and 209 in TBEV (in the fg loop) is also an insertion in tick-borne with respect to mosquito-borne flaviviruses, and therefore is not marked. The i3 insertion in TBEV E is indicated by broken lines since this segment is α helical in flaviviruses and extended in alphaviruses (shown by stretching the residues so that only every third or fourth amino acid in E1 has its counterpart in E in this region of the alignment). The i1′ and i2′ insertions in SFV E1 occur downstream of the two α-helices observed in dII, at regions of contact with s1, and are postulated to compensate for the less bulky s1 region compared to H1.
Figure 2
Conformational rearrangement of protein E. Comparison of the overall organization of the protein in the neutral- and acid-pH forms. The ‘top' and ‘side' views are indicated in the top and bottom rows, respectively. The three domains of sE are labeled dI, dII, and dIII. The color coding is defined in the legend to Figure 1. (A) Neutral–pH, dimeric conformation of sE in a surface representation. The carbohydrate residues (labeled CHO) are indicated in pink. A ribbon diagram is intercalated between the top and side views, at the same scale and orientation as the foreground subunit in the side view. Several β-sheets that are referred to in the text are indicated (i.e., the top and bottom β-sheets of dI, the klD0 and gfeah sheets of dII). In the ribbon diagram, the arrows representing the β-strands in the bottom sheet of dI are white. The last amino acid observed in the crystal structure (K395; Rey et al, 1995) is indicated by an open blue star, labeled C-term. The lipid bilayer is diagrammed at the same scale underneath the dimer in the side view, with the aliphatic region in pale yellow and the lipid head regions in gray. (B) Low-pH conformation of sE. As in panel A, only one subunit is colored and the others are shown in white and gray. The arrows show the dimensions of the molecule, including all atoms with a Van der Waals radius of 2 Å. In the side view, the purple region indicates the dIII/stem linker, which ends at the last amino acid visible in the electron density map (R401) indicated by an open red star (labeled C-ter). Note the vertical groove that follows the C-terminus along the interface between neighboring dIIs in the trimer. The lipid bilayer is diagrammed as in (A), indicating the postulated interaction of the fusion peptide loops with the lipid heads. (C) Ribbon diagram of the polypeptide chain of sE in the trimeric conformation. In the top view, note the extended conformation of the dI/dIII linker (purple). In the side view, only the colored subunit displayed in (B) is shown for clarity. The disordered segments (the E0F0 loop in dI and the fg loop in dII) are indicated by broken lines and labeled. The C-terminus is indicated as in (B). It shows that the predicted α-helix H1 of the stem would interact with the two short helices of dII. (D) Conformational rearrangement of sE. dI of the sE subunit in the conformation observed in the dimer (Figure 1A) was superposed on dI of the colored subunit in the trimer shown in (C), as explained in the text. Curved gray arrows show the movement of the domains to reach the conformation indicated in (C). In the side view, the two β-sheets of dII that change their relative orientation are labeled (klD0 and gfeah).
Figure 3
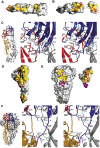
Comparison of the intra-oligomeric and intra-subunit contacts of E before and after the low-pH-induced conformational change. The interactions within the dimeric form are indicated in panels A–C and those in the trimeric form in D–F. In the surface representations of panels A, B, D, and E, the contact regions are indicated in yellow, with the patches formed by conserved residues in orange. Conserved residues outside the contact area are shown in dark gray. The domains are labeled as in Figure 2. (A) sE dimer contacts. The foreground subunit of the dimer, in the side orientation shown in Figure 2A, bottom panel, was removed to show its imprint on the subunit in the background. Except for the fusion peptide loop (labeled with W101), the dimer contact area is essentially made by nonconserved residues. (B) dI/dIII contact surface within the sE dimer. The subunit in (A) was rotated by about 45° about a vertical axis passing through the dI/dIII interface. dIII was then cut out and rotated by 180° about the same axis to show the interaction surface. Note the strong orange patch of conserved residues on both interacting surfaces. Some residues are labeled to allow comparison with the area involved in contacts in the trimeric form. (C) Stereo diagram showing the interactions between dI and dIII across the interface shown in (B). On the left, a square superposed on the ribbon diagram of the sE dimer indicates the region corresponding to the enlargement shown on the right. The polypeptide backbone is shown as ribbons colored according to domains, and gray for the neighboring subunit. The side chains are shown as ball and stick, colored according to atom type (nitrogen: blue; oxygen: red; carbon: light red for dI, light blue for dIII, gray for the adjacent subunit). Water molecules trapped at the interface are shown as red spheres. Hydrogen bonds are indicated as broken cyan lines. The amino acids involved in the contact are labeled, with conserved residues underlined. The secondary structure elements are labeled in white, following Figure 1. (D) sE trimer contacts. The orientation corresponds to that of the subunit in the foreground in Figure 2B, lower panel, which has been rotated 180° about the vertical axis, to show the regions involved in contacts (thus, dIII is on the left). Note the discontinuity of contacts in the central part of dII. Most of the conserved residues have been labeled. Note their distribution at the periphery of the contact area. (E) Contacts made by dIII and the dIII/stem linker in the trimer. The orientation of the trimer is the same as that shown in Figure 2B, lower panel. dIII and the dIII/stem linker were cut from the trimer and rotated by 180° about a vertical axis, shown on the right. Note that the face of dIII involved in the contacts is the same one that faces dI in the dimer (compare the location of H323 and P360, labeled in both panels B and D). The surface of contact of the dIII/stem linker is shown in purple (as well as the residues in the body of the trimer that contact it) with conserved residues colored pink. dI′ and dII′ label the contacted domains from the adjacent subunit (in gray in Figure 2). (F) The ribbons diagram of the left indicates the region of the enlargement shown on the stereo diagram of the right, which depicts the interactions at the interface displayed in (E), the lower half. The color coding is as in (C), with the main chain of the dIII/stem linker in purple, and its side chains as ball and sticks with carbon atoms colored pink. Note the same conserved histidine residue seen in (C) (H323) as being part of the new set of interactions with dI. Note the proximity of helices αA and αB of dII to the C-terminus (R401) of sE, which in the intact molecule would bring them into contact with helix H1.
Figure 4
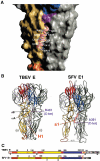
H1 helix of the stem. Comparison of the closed (TBEV) and open (SFV) conformations of the low-pH-induced trimers. As in Figure 2, the subunit in the foreground is colored and those in the background are gray. (A) Close-up view of the side of the trimer in a surface representation, with the dIII/stem linker, colored purple, ending at a groove at the interface between dIIs in the trimer. Helix H1 was modeled within the groove as explained in the text, and its backbone is displayed as a pink thick ribbon. The exposed side chains are displayed as ball and stick, colored according to atom type (carbon: white; nitrogen: blue; oxygen: red). The exposed side chains are labeled. The conserved residues at the N-terminal side of the helix (see Figure 1) are buried and interact with conserved residues from dII, as explained in the text. (B) Side-to-side comparison of the structure of the sE trimer with the modeled H1 helix (left) and the SFV E1 trimer (Gibbons et al, 2004) (right) in a ribbons representation. The molecules were superposed on dI, and are oriented as in Figure 2B, bottom panel. The αA and αB helices of dII are labeled. The modeled H1 helix is indicated in a semitransparent pink ribbon, showing that its path in between dII is similar to that of the s1 segment in SFV E1 (shown as a thick pink ribbon). In the latter, the fusion peptide loops are about 45 Å apart (indicated by the gray arrow). We postulate that the presence of the H1 helix will force the tips of dII to move apart (indicated by the two large gray arrows at either side of the sE trimer). (C) Linear representation of the alignment between the two proteins represented in panel B. Each domain is indicated by color bars according to the color code defined in Figure 1, roughly to scale. The s1 and H1 segments, in pink (labeled in red), are necessary for the molecule to adopt a conformation that can lead to a hemifusion intermediate, as explained in the text. In TBEV, cs indicates a conserved sequence (in gray) in between the H1 and H2 helices. The insertions in each of the molecules (i1–i4) defined in Figure 1 are also indicated.
Figure 5
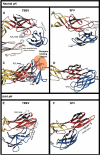
Comparison of the fusogenic structural transition of TBEV E and SFV E1. Ribbon diagram showing the changes that take place in the dI/dIII area of the molecule. The two molecules were superposed on dI (see Table II for rms deviation values). TBEV E is displayed on the left and SFV E1 on the right. The top panels (A, B) show a view from the top, looking down the flavivirus particle. All the other panels (C, D, E, F) show a side view, with dI always in the same orientation. The i1 and i2 insertions in TBEV E dI (from Figure 1) are colored white within the red dI ribbon. Residues from the dI/dIII linker are shown in gray. The β-strands are labeled; note the dI bottom sheet indicated in Figure 2 formed by strands G0H0I0B0 and the dI top sheet by F0E0D0C0A0. The residues at the beginning and end of the A0 strand are labeled to facilitate the description in the text. Strand A0′ is labeled in blue (panel E).
Figure 6
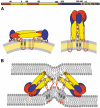
Diagram of the full-length E protein in its different conformations. Organization of the flavivirus E protein in three conformations: on the mature viral particle, in its postfusion form, and in the asymmetric, low-pH-induced intermediate conformation, responsible for the hemifusion step. The linear diagram at the top summarizes the arrangement of domains polypeptide segments, defining the color code used in (A, B). (A) Cartoon of TBEV E as lying on the viral membrane at neutral pH, as observed in the dengue virus particles (Zhang et al, 2003a) (left panel), and in its final, postfusion conformation change (right panel). (B) Proposed structural intermediate responsible for causing fusion of the outer leaflets of the target and viral membranes (hemifusion step). Helix H1 maintains the tips of dII in an open conformation, allowing two-fold related lateral interaction between adjacent trimers via the fusion peptide loops. This arrangement leads to the formation of a ring of five trimers, each interacting identically with its neighbors, which destabilizes the target membrane by creating a lipid nipple. We propose that the H2 segment of the polypeptide chain is used to accommodate the temporary symmetry violation during this intermediate, acting as a tether to the TM segments. Zipping up of the H2 (or s2 segment in SFV) will force juxtaposition of the fusion peptide loops and the TM segments, forcing the opening of an initial fusion pore, as proposed for SFV E1 (Gibbons et al, 2004). For clarity, only two trimers are drawn (out of five proposed to form a closed ring).
Similar articles
- Characterization of a structural intermediate of flavivirus membrane fusion.
Stiasny K, Kössl C, Lepault J, Rey FA, Heinz FX. Stiasny K, et al. PLoS Pathog. 2007 Feb;3(2):e20. doi: 10.1371/journal.ppat.0030020. PLoS Pathog. 2007. PMID: 17305426 Free PMC article. - Role of metastability and acidic pH in membrane fusion by tick-borne encephalitis virus.
Stiasny K, Allison SL, Mandl CW, Heinz FX. Stiasny K, et al. J Virol. 2001 Aug;75(16):7392-8. doi: 10.1128/JVI.75.16.7392-7398.2001. J Virol. 2001. PMID: 11462011 Free PMC article. - Structures of vesicular stomatitis virus glycoprotein: membrane fusion revisited.
Roche S, Albertini AA, Lepault J, Bressanelli S, Gaudin Y. Roche S, et al. Cell Mol Life Sci. 2008 Jun;65(11):1716-28. doi: 10.1007/s00018-008-7534-3. Cell Mol Life Sci. 2008. PMID: 18345480 Free PMC article. Review. - The machinery for flavivirus fusion with host cell membranes.
Heinz FX, Allison SL. Heinz FX, et al. Curr Opin Microbiol. 2001 Aug;4(4):450-5. doi: 10.1016/s1369-5274(00)00234-4. Curr Opin Microbiol. 2001. PMID: 11495810 Review.
Cited by
- Antibodies against the envelope glycoprotein promote infectivity of immature dengue virus serotype 2.
da Silva Voorham JM, Rodenhuis-Zybert IA, Ayala Nuñez NV, Colpitts TM, van der Ende-Metselaar H, Fikrig E, Diamond MS, Wilschut J, Smit JM. da Silva Voorham JM, et al. PLoS One. 2012;7(3):e29957. doi: 10.1371/journal.pone.0029957. Epub 2012 Mar 14. PLoS One. 2012. PMID: 22431958 Free PMC article. - Furin cleavage potentiates the membrane fusion-controlling intersubunit disulfide bond isomerization activity of leukemia virus Env.
Sjöberg M, Wallin M, Lindqvist B, Garoff H. Sjöberg M, et al. J Virol. 2006 Jun;80(11):5540-51. doi: 10.1128/JVI.01851-05. J Virol. 2006. PMID: 16699035 Free PMC article. - Epitope determinants of a chimpanzee dengue virus type 4 (DENV-4)-neutralizing antibody and protection against DENV-4 challenge in mice and rhesus monkeys by passively transferred humanized antibody.
Lai CJ, Goncalvez AP, Men R, Wernly C, Donau O, Engle RE, Purcell RH. Lai CJ, et al. J Virol. 2007 Dec;81(23):12766-74. doi: 10.1128/JVI.01420-07. Epub 2007 Sep 19. J Virol. 2007. PMID: 17881450 Free PMC article. - Negative potentials across biological membranes promote fusion by class II and class III viral proteins.
Markosyan RM, Cohen FS. Markosyan RM, et al. Mol Biol Cell. 2010 Jun 15;21(12):2001-12. doi: 10.1091/mbc.e09-10-0904. Epub 2010 Apr 28. Mol Biol Cell. 2010. PMID: 20427575 Free PMC article. - Small interfering RNA profiling reveals key role of clathrin-mediated endocytosis and early endosome formation for infection by respiratory syncytial virus.
Kolokoltsov AA, Deniger D, Fleming EH, Roberts NJ Jr, Karpilow JM, Davey RA. Kolokoltsov AA, et al. J Virol. 2007 Jul;81(14):7786-800. doi: 10.1128/JVI.02780-06. Epub 2007 May 9. J Virol. 2007. PMID: 17494077 Free PMC article.
References
- Bricogne G (1993) Buster. Acta Crystallogr D 49: 37–60 - PubMed
- Brünger AT, Adams PD, Clore GM, DeLano WL, Gros P, Grosse-Kunstleve RW, Jiang JS, Kuszewski J, Nilges M, Pannu NS, Read RJ, Rice LM, Simonson T, Warren GL (1998) Crystallography & NMR system: A new software system for macromolecular structure determination. Acta Crystallogr D 54: 905–921 - PubMed
- Carson M (1987) Ribbon models of macromolecules. J Mol Graphics 5: 103–106
Publication types
MeSH terms
Substances
LinkOut - more resources
Full Text Sources
Other Literature Sources


