Enhanced neuronal excitability in the absence of neurodegeneration induces cerebellar ataxia - PubMed (original) (raw)
Enhanced neuronal excitability in the absence of neurodegeneration induces cerebellar ataxia
Vikram G Shakkottai et al. J Clin Invest. 2004 Feb.
Abstract
Cerebellar ataxia, a devastating neurological disease, may be initiated by hyperexcitability of deep cerebellar nuclei (DCN) secondary to loss of inhibitory input from Purkinje neurons that frequently degenerate in this disease. This mechanism predicts that intrinsic DCN hyperexcitability would cause ataxia in the absence of upstream Purkinje degeneration. We report the generation of a transgenic (Tg) model that supports this mechanism of disease initiation. Small-conductance calcium-activated potassium (SK) channels, regulators of firing frequency, were silenced in the CNS of Tg mice with the dominant-inhibitory construct SK3-1B-GFP. Transgene expression was restricted to the DCN within the cerebellum and was detectable beginning on postnatal day 10, concomitant with the onset of cerebellar ataxia. Neurodegeneration was not evident up to the sixth month of age. Recordings from Tg DCN neurons revealed loss of the apamin-sensitive after-hyperpolarization current (IAHP) and increased spontaneous firing through SK channel suppression, indicative of DCN hyperexcitability. Spike duration and other electrogenic conductance were unaffected. Thus, a purely electrical alteration is sufficient to cause cerebellar ataxia, and SK openers such as the neuroprotective agent riluzole may reduce neuronal hyperexcitability and have therapeutic value. This dominant-inhibitory strategy may help define the in vivo role of SK channels in other neuronal pathways.
Figures
Figure 1
Characterization of SK3-1B-GFP Tg mice. (a) Locations of Thy1.2 (gray) and SK3-1B-GFP in transgene cassette with BamHI restriction sites indicated by arrows (numbers above arrows represent kilobases from 5′ end of cassette). Initiation codon is indicated by inverted arrowhead. A 5.4-kb probe for Southern blot analysis is indicated by line below cassette. (b) BamHI digests of tail DNA in D11 and D2. Molecular weights (in kilobases: 23, 9.4, 6.6, 2.3). A 9.2-kb endogenous band (E) seen in all lanes. Tg-specific bands (Tg) seen in D11 lanes 1, 2, 4, 6, 7 and in D2 lanes 1 and 3. (c) Western blot analysis of brain extracts probed with anti-GFP and anti–β-actin Ab’s.
Figure 2
Performance on motor tasks. (a) Stationary rod; (b) rotarod; (c) hanging wire task; (d) hindfoot-forefoot discordance (n = 7–14 Tg; 6–12 non-Tg). D11 non-Tg (filled triangles), D2 non-Tg (open triangles), D11 Tg (closed squares), D2 Tg (open squares) (n = 10–19 Tg; 9–18 non-Tg). Body weights: 4 weeks old: Tg 18.5 ± 0.9 g, non-Tg 17.6 ± 0.8 g; 12 weeks old: Tg 26.9 ±1.3 g, non-Tg 25.7 ± 1.2 g. Error bars = SEM.
Figure 3
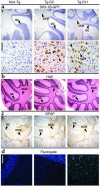
SK3-1B-GFP is expressed in DCN neurons that express SK1 and SK2 and does not cause neurodegeneration. (a) Immunoperoxidase staining for GFP with hematoxylin counterstaining revealed transgene expression in the large neurons in the DCN (brown cells indicated by arrowheads in middle and right panels) but not in the cerebellar cortex (indicated by arrowhead pointing to granule cell layer in cerebellar cortex) shown at 5 weeks of age. GC, granule cell layer. (b) In sections from 12-week-old mice stained with H&E, cerebellar architecture appears normal. (c) There is no evidence of reactive gliosis in Tg cerebellar sections immunostained for GFAP at 12 weeks of age. (d) Fluorojade shows no staining (blue DAPI counterstained cells with no green fluorojade-positive cells) in cerebellar sections from mice aged 12 weeks. Scale bars = 100 μm.
Figure 4
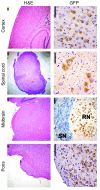
Transgene expression in different regions of the brain. H&E staining (left) and transgene expression (right) in the layer V neocortex, spinal cord anterior horn cells, red nucleus, and pontine nucleus (brown). In the midbrain section tyrosine hydroxylase–positive neurons appear blue. SN, substantia nigra, RN, red nucleus. Scale bars = 100 μm.
Figure 5
Grading scheme for transgene expression levels. Examples of sections immunostained for GFP showing relative expression levels and corresponding grade from – to +++. Scale bar = 100 μm.
Figure 6
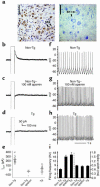
Transgene-expressing DCN neurons are hyperexcitable. (a) DCN neurons express SK2 (indicated by arrowheads pointing to brown SK2 cells) and SK1 (arrowheads points to blue SK1 cells). SK3 was detected in the midbrain but not in the DCN (not shown). Scale bars = 100 μm. (b) IAHP in non-Tg DCN. (c) IAHP in non-Tg DCN is apamin-sensitive. (d) IAHP is absent from Tg DCN. (e) IAHP amplitude data summarized. (f) Non-Tg DCN neurons fire spontaneously at approximately 6.3 Hz and exhibit a prominent post-spike after-hyperpolarization. (g) Non-Tg DCN exposed to 100 nM apamin fire more rapidly at approximately 15.2 Hz and do not show the after-hyperpolarization. (h) Tg DCN fire spontaneously at approximately 16.6 Hz and lack the after-hyperpolarization. (i) Summary of mean firing frequency (left) and spike width measured at half amplitude (right). Error bars = SEM.
Figure 7
Other conductances in Tg neurons are unaffected. (a) Amplitude of apamin-resistant K+ currents in non-Tg and Tg DCN neurons (n = 6 non-Tg, 32 Tg). (b) Peak voltage-gated Ca2+ currents in Tg and non-Tg DCN neurons. (c) Ca2+ currents in Tg DCN neurons demonstrating Ca2+-CaM–dependent but not Ba2+-dependent current inactivation. The Ba2+ trace is scaled to the peak amplitude of the Ca2+ trace (d). Ca2+ current inactivation summarized (n = 5 non-Tg, 8 Tg; P > 0.05). CaV, voltage-gated CA2+. Error bars = SEM.
Comment in
- Into the depths of ataxia.
Orr HT. Orr HT. J Clin Invest. 2004 Feb;113(4):505-7. doi: 10.1172/JCI21092. J Clin Invest. 2004. PMID: 14966557 Free PMC article.
Similar articles
- Co-treatment with riluzole, a neuroprotective drug, ameliorates the 3-acetylpyridine-induced neurotoxicity in cerebellar Purkinje neurones of rats: behavioural and electrophysiological evidence.
Janahmadi M, Goudarzi I, Kaffashian MR, Behzadi G, Fathollahi Y, Hajizadeh S. Janahmadi M, et al. Neurotoxicology. 2009 May;30(3):393-402. doi: 10.1016/j.neuro.2009.02.014. Epub 2009 Mar 5. Neurotoxicology. 2009. PMID: 19442824 - Morphological and electrophysiological properties of GABAergic and non-GABAergic cells in the deep cerebellar nuclei.
Uusisaari M, Obata K, Knöpfel T. Uusisaari M, et al. J Neurophysiol. 2007 Jan;97(1):901-11. doi: 10.1152/jn.00974.2006. Epub 2006 Nov 8. J Neurophysiol. 2007. PMID: 17093116 - Ion channel dysfunction in cerebellar ataxia.
Bushart DD, Shakkottai VG. Bushart DD, et al. Neurosci Lett. 2019 Jan 1;688:41-48. doi: 10.1016/j.neulet.2018.02.005. Epub 2018 Feb 5. Neurosci Lett. 2019. PMID: 29421541 Free PMC article. Review. - Mutant mice as a model for cerebellar ataxia.
Grüsser-Cornehls U, Bäurle J. Grüsser-Cornehls U, et al. Prog Neurobiol. 2001 Apr;63(5):489-540. doi: 10.1016/s0301-0082(00)00024-1. Prog Neurobiol. 2001. PMID: 11164620 Review.
Cited by
- PTPRR, cerebellum, and motor coordination.
Schmitt I, Bitoun E, Manto M. Schmitt I, et al. Cerebellum. 2009 Jun;8(2):71-3. doi: 10.1007/s12311-009-0118-4. Cerebellum. 2009. PMID: 19488825 Review. - Cerebellar ataxias: β-III spectrin's interactions suggest common pathogenic pathways.
Perkins E, Suminaite D, Jackson M. Perkins E, et al. J Physiol. 2016 Aug 15;594(16):4661-76. doi: 10.1113/JP271195. Epub 2016 Apr 24. J Physiol. 2016. PMID: 26821241 Free PMC article. Review. - Vestibular Performance During High-Acceleration Stimuli Correlates with Clinical Decline in SCA6.
Huh YE, Kim JS, Kim HJ, Park SH, Jeon BS, Kim JM, Cho JW, Zee DS. Huh YE, et al. Cerebellum. 2015 Jun;14(3):284-91. doi: 10.1007/s12311-015-0650-3. Cerebellum. 2015. PMID: 25624155 - Spinocerebellar ataxias: prospects and challenges for therapy development.
Ashizawa T, Öz G, Paulson HL. Ashizawa T, et al. Nat Rev Neurol. 2018 Oct;14(10):590-605. doi: 10.1038/s41582-018-0051-6. Nat Rev Neurol. 2018. PMID: 30131520 Free PMC article. Review. - BK channels control cerebellar Purkinje and Golgi cell rhythmicity in vivo.
Cheron G, Sausbier M, Sausbier U, Neuhuber W, Ruth P, Dan B, Servais L. Cheron G, et al. PLoS One. 2009 Nov 24;4(11):e7991. doi: 10.1371/journal.pone.0007991. PLoS One. 2009. PMID: 19956720 Free PMC article.
References
- Rosenberg RN. The genetic basis of ataxia. Clin. Neurosci. 1995;3:1–4. - PubMed
- Klockgether T, Dichgans J. The genetic basis of hereditary ataxia. Prog. Brain Res. 1997;114:569–576. - PubMed
- Grusser-Cornehls U, Baurle J. Mutant mice as a model for cerebellar ataxia. Prog. Neurobiol. 2001;63:489–540. - PubMed
- Trouillas P, et al. International Cooperative Ataxia Rating Scale for pharmacological assessment of the cerebellar syndrome. The Ataxia Neuropharmacology Committee of the World Federation of Neurology. J. Neurol. Sci. 1997;145:205–211. - PubMed
- Figueroa KP, et al. Association of moderate polyglutamine tract expansions in the slow calcium-activated potassium channel type 3 with ataxia. Arch. Neurol. 2001;58:1649–1653. - PubMed
Publication types
MeSH terms
Substances
LinkOut - more resources
Full Text Sources
Other Literature Sources
Molecular Biology Databases
Miscellaneous


