CpG-matured murine plasmacytoid dendritic cells are capable of in vivo priming of functional CD8 T cell responses to endogenous but not exogenous antigens - PubMed (original) (raw)
Comparative Study
CpG-matured murine plasmacytoid dendritic cells are capable of in vivo priming of functional CD8 T cell responses to endogenous but not exogenous antigens
Mariolina Salio et al. J Exp Med. 2004.
Abstract
Plasmacytoid dendritic cells (PDCs) are a unique leukocyte population capable of secreting high levels of type I interferon (IFN) in response to viruses and bacterial stimuli. In vitro experiments have shown that upon maturation, human and murine PDCs develop into potent immunostimulatory cells; however, their ability to prime an immune response in vivo remains to be addressed. We report that CpG-matured murine PDCs are capable of eliciting in naive mice antigen-specific CTLs against endogenous antigens as well as exogenous peptides, but not against an exogenous antigen. Type I IFN is not required for priming, as injection of CpG-matured PDCs into type I IFN receptor-deficient mice elicits functional CTL responses. Mature PDCs prime CTLs that secrete IFN-gamma and protect mice from a tumor challenge. In contrast, immature PDCs are unable to prime antigen-specific CTLs. However, mice injected with immature PDCs are fully responsive to secondary antigenic challenges, suggesting that PDCs have not induced long-lasting tolerance via anergic or regulatory T cells. Our results underline the heterogeneity and plasticity of different antigen-presenting cells, and reveal an important role of mature PDCs in priming CD8 responses to endogenous antigens, in addition to their previously reported ability to modulate antiviral responses via type I IFN.
Figures
Figure 1.
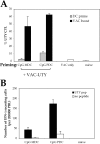
Intravenous injection of CpG-matured male PDCs induces CTL responses. (A) C57BL/6 mice (n = 5) were injected i.v. with 105 male MDC or PDCs, immature or CpG matured. Control animals were injected with female MDC. CTL responses were assessed in the blood by ex vivo FACS® analysis using UTY246–254-H-2-Db tetramers 7 d after priming. Mean proportions of tetramer+ cells as a percentage of CD8 cells (± SEM) for each group are shown. (B) C57BL/6 mice (n = 5) were injected with graded numbers of male CpG-matured MDC (gray bars) or PDCs (black bars) and boosted after 1 wk with UV-inactivated vaccinia-UTY246–254 minigene. CTL responses were assessed in the blood by ex vivo tetramer staining 8 d after boosting. Tetramer stainings of control mice, primed by female MDC or by vaccinia-UTY246–254 minigene alone, are shown (white bars).
Figure 2.
Intravenous injection of CpG-matured male PDCs induces functional CTL responses. C57BL/6 mice (n = 5) were primed as described in Fig. 1 A. (A) CTL responses were assessed in the blood by ex vivo FACS® analysis using UTY246–254-H-2-Db tetramers 7 d after priming. One representative animal per group is shown. (B) 10 d after priming, cytolytic activity of the UTY246–254-specific cells was assessed in vivo against female syngeneic splenocytes unpulsed or peptide pulsed (CFSE labeled), male splenocytes unpulsed (CFSE labeled), or peptide pulsed (5-(and 6)-([{4-chloromethyl}benzoyl]amino) tetramethylrhodamine labeled) as summarized in the cartoon. Correlation between tetramer staining (A) and lysis of CFSE-labeled target cells at 17 and 96 h (B) is shown. The mouse primed by CpG-PDCs has a total of 2% UTY246–254-CTL (as a percentage of CD8 cells). (C) Analysis of mean antigen-specific lysis 17 h after target cell injection, calculated as described in Materials and Methods. Cells used for priming are shown on the x axis. Each panel depicts specific lysis of the labeled targets (top left).
Figure 3.
Intravenous injection of CpG-matured male PDCs induces IFN-γ–secreting CTL. C57BL/6 mice (n = 5) were primed as described in Fig. 1. ELISPOT assay was performed on blood PBLs to assess IFN-γ secretion by antigen-specific cells in response to 10 μg/ml UTY246–254 peptide 7 d after priming. All animals showed comparable responses to PHA stimulation (not depicted).
Figure 4.
Intravenous injection of CpG-matured male PDCs induces type I polarization of spleen CTL. C57BL/6 mice (n = 3) were injected i.v. with 105 male CpG-matured MDC or PDCs. Splenocytes from a mouse primed by CpG-matured PDCs were in vitro restimulated with UTY246–254 peptide or PMA and ionomycin, and intracellular cytokine accumulation was assessed as described in Materials and Methods 8 d after priming. The tetramer staining for the same sample is also shown. One experiment representative of three is shown. Similar profiles were obtained in mice primed by CpG-matured male MDC, whereas naive female C57BL/6 controls did not respond to the peptide.
Figure 5.
Intravenous injection of CpG-matured male splenic PDCs induces CTL responses. C57BL/6 mice (n = 3) were injected i.v. with 0.5 × 10⁵ male splenic MDC or PDCs (isolated from CpG-treated animals) and boosted after 1 wk with UV-inactivated vaccinia-UTY246–254 minigene. (A) CTL responses were assessed in the blood by ex vivo FACS® analysis using UTY246–254-H-2-Db tetramers 8 d after boosting. Mean proportions of tetramer+ cells as a percentage of CD8 cells (± SEM) for each group are shown. (B) IFN-γ ELISPOT was performed on splenocytes to assess responsiveness to 10 μg/ml UTY246–254 peptide 9 d after boosting. All animals showed comparable responses to PHA stimulation (not depicted).
Figure 6.
Direct presentation and not cross-priming accounts for expansion of UTY246–254-specific CTL. C57BL/6 mice were injected i.v. with the indicated numbers of male immature or CpG-matured BM-DCs (generated in FLT3-L). CTL responses were assessed in the blood by FACS® analysis using UTY246–254-H-2-Db tetramers 7 d after priming, and dot plot profiles for individual mice are shown. Only the mice injected with 106 BM-DCs showed secondary responses after boosting with vaccinia-UTY246–254 minigene (not depicted).
Figure 7.
Intravenous injection of immature male PDCs does not prevent induction of subsequent UTY246–254 responses. C57BL/6 mice (n = 3) were primed as described in Fig. 1. 10 d after priming, cytolytic activity of the UTY246–254-specific cells was assessed in vivo against female or male syngeneic splenocytes unpulsed or peptide pulsed (as detailed in Fig. 1). The analysis of mean antigen-specific lysis 17 h (A) and 1 wk (B) after target cells injection is shown, calculated as described in Materials and Methods. The priming conditions are specified on the x axis. The first group of mice (controls) was injected with labeled splenocytes only and not with DC. The second group of mice was primed by female MDC, to control for responses to components of FCS used in the BM cultures. The high numbers of splenocytes used for the in vivo killing assay primes UTY246–254-specific CTL within 7 d (28), and this is reflected by the specific clearance of male splenocytes shown in B but absent at the earlier time point. The lack of clearance of peptide-pulsed female splenocytes reflects the short half life of the peptide on the surface of these cells, which, therefore, represent an important internal control for the experiment. (C) Mean proportions of tetramer+ cells as a percentage of CD8 cells (± SEM) for each group 7 d after PDC priming (white bar) and 1 wk after the in vivo killing assay (black bars). (D) IFN-γ ELISPOT performed on blood PBLs to assess responsiveness to 10 μg/ml UTY246–254 peptide 1 wk after the in vivo killing assay. All animals showed comparable responses to PHA stimulation (not depicted). The same groups of animals are shown in A–D. (E and F) Mean proportions of UTY246–254-H-2-Db tetramer+ cells as a percentage of CD8 cells (± SEM) after in vivo boosting with male immature DCs (E, staining performed at day 7) or UV-inactivated vaccinia-UTY246–254 minigene (F, staining performed at day 8).
Figure 8.
Type I IFN receptor–deficient CpG-matured male PDCs prime IFN-γ–secreting CTL. Type I IFN receptor–deficient mice (129A; n = 2) were injected i.v. with 0.6 × 10⁵ CpG-matured MDC or PDCs (also generated from 129A mice). 2 wk after priming, mice were boosted with UV-inactivated vaccinia-UTY246–254 minigene. (A) CTL responses were assessed in the blood by FACS® analysis using UTY246–254-H-2-Db tetramers 9 d after priming (gray bars) or 8 d after boosting (black bars). Tetramer stainings of control mice, naive or primed by vaccinia-UTY246–254 minigene alone, are shown as white bars (the priming conditions are specified on the x axis). Mean proportions of tetramer+ cells as a percentage of CD8 cells (± SEM) for each group are shown. (B) IFN-γ ELISPOT was performed on blood PBLs to assess responsiveness to 10 μg/ml UTY246–254 peptide 9 d after priming. All animals showed comparable responses to PHA stimulation (not depicted).
Figure 9.
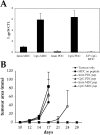
Priming by CpG-matured PDCs induces protective CTL responses. C57BL/6 mice (n = 5) were primed by intravenous injection of 2 × 10⁵ immature or CpG-matured MDC or PDCs pulsed with 1 μg/ml LCMV gp34–41 peptide. Control animals were injected with unpulsed CpG-DCs. (A) CTL responses were assessed in the blood by FACS® analysis using LCMV gp34–41-H-2-Kb tetramers 7 d after priming. Mean proportions of tetramer+ cells as a percentage of CD8 cells (± SEM) for each group are shown. (B) Progression of B16-F10-gp33 tumors implanted s.c. 10 d after priming. Mean tumor sizes per group ± SEM are shown. An additional control group (n = 5) that did not receive DCs was included.
Figure 10.
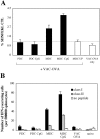
Lack of presentation of soluble ovalbumin by bone marrow–derived PDCs. BM cultures were pulsed on day 10 with 500 μg /ml of soluble ovalbumin in the presence or absence of CpG. MDC and PDCs were sorted on day 11. C57BL/6 mice (n = 3) were primed by intravenous injection of 105 cells and boosted after 10 d with vaccinia virus encoding full-length ovalbumin. (A) CTL responses were assessed in the blood by FACS® analysis using SIINFEKL-H-2-Kb tetramers 7 d after boosting. Mean proportions of tetramer+ cells as a percentage of CD8 cells (± SEM) for each group are shown. (B) IFN-γ ELISPOT was performed on splenocytes to assess responsiveness to ovalbumin MHC class I (SIINFEKL) and class II–restricted peptides (each at 10 μg/ml) 10 d after boosting. All animals showed comparable responses to PHA stimulation (not depicted).
Similar articles
- Plasmacytoid dendritic cells cross-prime naive CD8 T cells by transferring antigen to conventional dendritic cells through exosomes.
Fu C, Peng P, Loschko J, Feng L, Pham P, Cui W, Lee KP, Krug AB, Jiang A. Fu C, et al. Proc Natl Acad Sci U S A. 2020 Sep 22;117(38):23730-23741. doi: 10.1073/pnas.2002345117. Epub 2020 Sep 2. Proc Natl Acad Sci U S A. 2020. PMID: 32879009 Free PMC article. - Ag-presenting CpG-activated pDCs prime Th17 cells that induce tumor regression.
Guéry L, Dubrot J, Lippens C, Brighouse D, Malinge P, Irla M, Pot C, Reith W, Waldburger JM, Hugues S. Guéry L, et al. Cancer Res. 2014 Nov 15;74(22):6430-40. doi: 10.1158/0008-5472.CAN-14-1149. Epub 2014 Sep 24. Cancer Res. 2014. PMID: 25252912 - Plasmacytoid dendritic cells mature independently of MyD88 and IFN-αβR in response to Listeria and stimulate CD8 T cells.
Tam MA, Wenzel UA, Wick MJ. Tam MA, et al. Immunol Lett. 2011 Aug 30;138(2):104-12. doi: 10.1016/j.imlet.2011.03.007. Epub 2011 Mar 29. Immunol Lett. 2011. PMID: 21453725 - Potential functional role of plasmacytoid dendritic cells in cancer immunity.
Kim R, Emi M, Tanabe K, Arihiro K. Kim R, et al. Immunology. 2007 Jun;121(2):149-57. doi: 10.1111/j.1365-2567.2007.02579.x. Epub 2007 Mar 20. Immunology. 2007. PMID: 17371541 Free PMC article. Review. - The versatile plasmacytoid dendritic cell: Function, heterogeneity, and plasticity.
Leylek R, Idoyaga J. Leylek R, et al. Int Rev Cell Mol Biol. 2019;349:177-211. doi: 10.1016/bs.ircmb.2019.10.002. Epub 2019 Oct 29. Int Rev Cell Mol Biol. 2019. PMID: 31759431 Review.
Cited by
- Crucial role of dendritic cells in the generation of anti-tumor T-cell responses and immunogenic tumor microenvironment to suppress tumor development.
Tominaga M, Uto T, Fukaya T, Mitoma S, Riethmacher D, Umekita K, Yamashita Y, Sato K. Tominaga M, et al. Front Immunol. 2024 Aug 14;15:1200461. doi: 10.3389/fimmu.2024.1200461. eCollection 2024. Front Immunol. 2024. PMID: 39206204 Free PMC article. - T Cell Features in Glioblastoma May Guide Therapeutic Strategies to Overcome Microenvironment Immunosuppression.
Losurdo A, Di Muzio A, Cianciotti BC, Dipasquale A, Persico P, Barigazzi C, Bono B, Feno S, Pessina F, Santoro A, Simonelli M. Losurdo A, et al. Cancers (Basel). 2024 Jan 31;16(3):603. doi: 10.3390/cancers16030603. Cancers (Basel). 2024. PMID: 38339353 Free PMC article. Review. - Innate Immunity in Cancer Biology and Therapy.
Zhang Y, Xue W, Xu C, Nan Y, Mei S, Ju D, Wang S, Zhang X. Zhang Y, et al. Int J Mol Sci. 2023 Jul 8;24(14):11233. doi: 10.3390/ijms241411233. Int J Mol Sci. 2023. PMID: 37510993 Free PMC article. Review. - Plasmacytoid dendritic cells: A dendritic cell in disguise.
Arroyo Hornero R, Idoyaga J. Arroyo Hornero R, et al. Mol Immunol. 2023 Jul;159:38-45. doi: 10.1016/j.molimm.2023.05.007. Epub 2023 Jun 1. Mol Immunol. 2023. PMID: 37269733 Free PMC article. Review. - Fatal COVID-19 is Associated with Reduced HLA-DR, CD123 or CD11c Expression on Circulating Dendritic Cells.
Hasan A, Al-Ozairi E, Hassan NYM, Ali S, Ahmad R, Al-Shatti N, Alshemmari S, Al-Mulla F. Hasan A, et al. J Inflamm Res. 2022 Oct 10;15:5665-5675. doi: 10.2147/JIR.S360207. eCollection 2022. J Inflamm Res. 2022. PMID: 36238761 Free PMC article.
References
- Banchereau, J., and R. Steinman. 1998. Dendritic cells and the control of immunity. Nature. 392:245–252. - PubMed
- Shortman, K., and Y.J. Liu. 2002. Mouse and human dendritic cell subtypes. Nat. Rev. Immunol. 2:151–161. - PubMed
- Cella, M., D. Jarrossay, F. Facchetti, O. Alebardi, H. Nakajima, A. Lanzavecchia, and M. Colonna. 1999. Plasmacytoid monocytes migrate to inflamed lymph nodes and produce large amounts of type I interferon. Nat. Med. 5:919–923. - PubMed
- Siegal, F., N. Kadowaki, M. Shodell, P. Fitzgerald-Bocarsly, K. Shah, S. Ho, S. Antonenko, and Y. Liu. 1999. The nature of the principal type 1 interferon-producing cells in human blood. Science. 284:1835–1837. - PubMed
- Salio, M., M. Cella, W. Vermi, F. Facchetti, M.J. Palmowski, C.L. Smith, D. Shepherd, M. Colonna, and V. Cerundolo. 2003. Plasmacytoid dendritic cells prime IFN-gamma-secreting melanoma-specific CD8 lymphocytes and are found in primary melanoma lesions. Eur. J. Immunol. 33:1052–1062. - PubMed
Publication types
MeSH terms
Substances
LinkOut - more resources
Full Text Sources
Other Literature Sources
Research Materials


