Eukaryotic protein synthesis inhibitors identified by comparison of cytotoxicity profiles - PubMed (original) (raw)
Eukaryotic protein synthesis inhibitors identified by comparison of cytotoxicity profiles
Jenny Chan et al. RNA. 2004 Mar.
Abstract
The National Cancer Institute (NCI) Human Tumor Cell Line Anti-Cancer Drug Screen has evaluated the cytotoxicity profiles of a large number of synthetic compounds, natural products, and plant extracts on 60 different cell lines. The data for each compound/extract can be assessed for similarity of cytotoxicity pattern, relative to a given test compound, using an algorithm called COMPARE. In applying a chemical biology approach to better understand the mechanism of eukaryotic protein synthesis, we used these resources to search for novel inhibitors of translation. The cytotoxicity profiles of 31 known protein synthesis inhibitors were used to identify compounds from the NCI database with similar activity profiles. Using this approach, two natural products, phyllanthoside and nagilactone C, were identified and characterized as novel protein synthesis inhibitors. Both compounds are specific for the eukaryotic translation apparatus, function in vivo and in vitro, and interfere with translation elongation. Our results demonstrate the feasibility of utilizing cytotoxicity profiles to identify new inhibitors of translation.
Figures
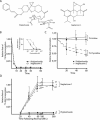
FIGURE 1.
Effect of phyllanthoside and nagilactone C on synthesis of protein, RNA, and DNA in vivo. (A) Structures of phyllanthoside and nagilactone C. (B) Effect of phyllanthoside and nagilactone C on protein synthesis in HeLa cells. The rate of protein synthesis (TCA precipitable counts per minute for a 5-min labeling period) obtained in the presence of compound was normalized to the rate obtained in the presence of DMSO and is plotted for 10 μM phyllanthoside and 50 μM nagilactone C. Results are shown for two experiments and the standard error is too small to be visualized. The relative rate of 35S-met incorporation of HeLa cells exposed to 600 μM cycloheximide (positive control) for 20 min was 0.04 (data not shown). The inset graph plots the relative rate of 35S-met incorporation as a function of phyllanthoside or nagilactone C concentration in HeLa cells. The rate of protein synthesis in the control reactions (containing DMSO vehicle) averaged 250,000 cpm per 10-min labeling. (C) Effect of phyllanthoside and nagilactone C on DNA (dashed lines) and RNA (solid lines) synthesis in HeLa cells. The rate of nucleic acid synthesis (TCA precipitable counts per minute for a 10-min labeling period) obtained in the presence of compound was normalized to the rate obtained in the presence of DMSO and is plotted for 10 μM phyllanthoside and 50 μM nagilactone C. Results are shown for two experiments and the standard error is shown. The rate of RNA and DNA synthesis in the control reactions (containing DMSO vehicle) averaged 13,000 cpm/10-min labeling and 5,000 cpm/10-min labeling, respectively. The relative rate of 3H-uridine incorporation of HeLa cells exposed to 50 μM actinomycin (positive control for inhibition of RNA synthesis) for 20 min was 0.02 (data not shown). (D) Assessment of reversal of inhibition of protein synthesis by phyllanthoside and nagilactone C after various periods of exposure to the compounds. HeLa cells were preincubated with 10 μM phyllanthoside or 50 μM nagilactone C for the indicated period of time, after which cells were washed three times and fresh media (lacking compound) was added to the cells. Ten minutes before harvesting at the indicated time points, 35S-methionine was added to the media. The relative rate of protein synthesis was determined by comparing to the rate obtained in control cells exposed to DMSO. Washout of cells exposed to 10 μM anisomycin for 20 min indicated that protein synthesis was back to 77% of control levels 40 min after reversal (data not shown).
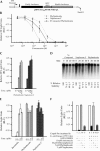
FIGURE 2.
(A) Schematic diagram of pSP/(CAG)33/FF/HCV/Ren. To generate mRNA for in vitro transcriptions, the plasmid was linearized with BamHI. The firefly luciferase coding region is denoted by a black box, whereas the renilla coding region is denoted by a gray box. The SP6 promoter is denoted by an open box. The HCV IRES (indicated by a thickened line) allows for internal initiation upstream of the renilla ATG. (B) Titration of phyllanthoside, nagilactone C, and 3′-desacetyl phyllanthoside in Krebs extracts. Translations were performed in the presence of the indicated amounts of compound and at a final mRNA and K+ concentration of 5 μg/mL and 100 mM, respectively. Because the final concentration of DMSO in the compound additions was 0.5%, control translation reactions contained 0.5% DMSO. The obtained firefly luciferase activities were normalized to the activity obtained in the control translations (which were set at one). Only the firefly luciferase data is shown, but similar results were obtained with renilla luciferase (data not shown). Each data point represents the average of seven translations and the standard error of the mean is shown. (C) Titration of phyllanthoside and nagilactone C in wheat germ translation extracts. Translation reactions were performed as indicated by the manufacturer’s recommendation (Promega Corp.) at an mRNA concentration of 5 μg/mL and a final K+ concentration of 150 mM. Because the HCV IRES is inactive in wheat germ extracts, only firefly luciferase activity was assessed and is plotted relative to the values obtained from control translations containing 0.5% DMSO. Each data point represents the average of two translations and the standard error is shown. (D) Relative stability of (CAG)33/FF/HCV/Ren mRNA in wheat germ extracts. Following reisolation from the translation extracts, radioactive mRNA was fractionated on a 1.4% agarose/formaldehyde gel and quantitated on a Fuji BAS2000 with a Fuji imaging screen. A representative autoradiograph from one experiment is shown. The percent relative stability of each time point (and standard error) is indicated below each lane and is an average from three experiments. Values were set relative to the value obtained at the beginning of the experiment (T = 0 min). The time points and the presence or absence of 50 μM phyllanthoside or nagilactone C in the translation reaction is indicated above the panel. (E) Translation reactions utilizing E. coli S30 extracts (Promega; for linear templates) were programmed with a lux AB mRNA transcript (Szittner and Meighen 1990), which had been produced by in vitro transcription reactions from pT7-5 (Dr. Ted Meighen, McGill University) utilizing T7 RNA polymerase, followed by treatment with DNAse I to remove any remaining plasmid DNA. Translations in E. coli S30 extracts were performed at a final mRNA concentration of 115 μg/mL and the luciferase activity of the product was measured as previously described (Szittner and Meighen 1990). Values are plotted relative to the light values from lux AB mRNA translated in the presence of vehicle (0.5% DMSO). The average of duplicate translations is shown as well as the standard error. (F) Phyllanthoside and nagilactone C are not modified to inactive derivatives in E. coli S30 extracts. Compounds (100 μM anisomycin, 100 μM chloramphenicol, 50 μM phyllanthoside, 50 μM nagilactone C) were incubated in E. coli S30 extracts for 1 h at 37°C. An aliquot (1 μL) was then taken and added to a Krebs ascites translation extract (9 μL) programmed with (CAG)33/FF/HCV/Ren mRNA (lanes 6_–_10). Lanes in which compounds were preincubated in E. coli S30 extracts, as well as the nature and final concentration of compounds in the ascites extracts, are indicated below the panel. (Lanes 1_–_5) Translations performed in ascites extracts in which the compounds were not preincubated in bacterial S30 extracts. The translational efficiency is expressed relative to the values obtained in the absence of compounds (lanes 1 and 6). The average of duplicate translations is shown as well as the standard error.
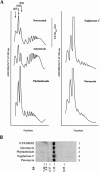
FIGURE 3.
Phyllanthoside and nagilactone C inhibit elongation of protein synthesis. (A) Phyllanthoside and nagilactone C do not prevent ribosome binding to mRNA templates. 32P-labeled CAT mRNA was incubated in rabbit reticulocyte lysates in the presence of 600 μM cycloheximide (CHX), 600 μM CHX and 10 μM phyllanthoside, or 600 μM CHX and 10 μM nagilactone C. Following centrifugation (SW40; 39,000 rpm/3.5 h), fractions of each sucrose gradient were collected using a Brandel Tube Piercer connected to an ISCO fraction collection, and were individually counted. Total counts recovered from each gradient and the percent mRNA bound to 80S complexes were: CAT mRNA/CHX, 41,008 cpm, 24% binding; CAT mRNA/phyllanthoside+CHX, 39,377 cpm, 28% binding; CAT mRNA/nagilactone C+CHX, 39,025 cpm, 27% binding. (B) Ribosome bindings performed with 32P-labeled CAT mRNA in rabbit reticulocyte lysates in the presence of 1 mM 5′-guanylylimidodiphosphate (GMP-PNP; to monitor 48S assembly). Initiation complexes were visualized as indicated above. Total counts recovered from each gradient and the percent mRNA bound were: CAT mRNA/CHX, 34,749 cpm, 15% binding; CAT mRNA/CHX+GMP-PNP, 31,705 cpm, 15% binding. (C) Phyllanthoside and nagilactone C can trap 80S complexes on mRNA templates. 32P-labeled CAT mRNA was incubated in rabbit reticulocyte lysates in the presence of 600 μM sparsomycin, 10 μM phyllanthoside, or 10 μM nagilactone C. Centrifugation was performed in an SW40 at 39,000 rpm for 3 h. Total counts recovered from each gradient and the percent mRNA bound to 80S complexes were: CAT mRNA/sparsomycin, 48,034 cpm, 15% binding; CAT mRNA/phyllanthoside, 48,033 cpm, 19% binding; CAT mRNA/nagilactone C, 47,662 cpm, 11% binding; CAT mRNA/puromycin, 46,093 cpm, 1% binding.
FIGURE 4.
(A) Effect of phyllanthoside and nagilactone C in vivo on polyribosomes. In each case shown, 10 μM anisomycin, phyllanthoside, or nagilactone C or 1 mM puromycin was added to a culture of HeLa cells for 20 min and the polyribosomes collected and analyzed as described in Materials and Methods. The polysome profile tracing is shown for each of the compounds tested and the scale bar corresponds to 0.5 OD260 units. (B) Northern blot analysis of RNA from HeLa cells exposed to translation inhibitors. HeLa cells were exposed to 0.5% DMSO (lane 1), 50 μM anisomycin (lane 2), 50 μM phyllanthoside (lane 3), 50 μM nagilactone C (lane 4), or 1 mM puromycin (lane 5), for 20 min and total RNA isolated using Trizol (Invitrogen). Seven micrograms of total RNA were fractionated on a 1.0% formaldehyde/agarose gel, transferred to Hybond N+, and hybridized with radiolabeled GAPDH DNA. Prehybridizations and hybridizations were performed in Church buffer. Two washes were performed with 2× SSC/0.1% SDS for 30 min at 65°C and one wash in 0.2× SSC/0.1%SDS for 30 min at 65°C. (C) Effect on polysomes of pretreating cells with anisomycin (5 min), followed by treatment with 10 μM homoharringtonine, 10 μM phyllanthoside, or 10 μM nagilactone C for 5 min. The polysome profile tracing is shown for each set of conditions tested and the scale bar corresponds to 0.5 OD260 units. (D,E) Effect of adding phyllanthoside and nagilactone C to an actively translating extract. Translations in Krebs extracts were initiated in the presence of 35S-methionine, and aliquots for TCA precipitation were removed at various time points. Five minutes after initiation of translation, compound (600 μM cycloheximide, 100 μM homoharringtonine, 10 μM phyllanthoside, or 50 μM nagilactone C) or vehicle (0.5% DMSO were added to the reaction (represented by a downward arrow) and the translation was continued for another 15 min, with aliquots for TCA precipitation being removed at the indicated times. Each data point is the average of two TCA precipitations.
FIGURE 5.
Nagilactone C inhibits peptidyl transferase. (A) Formation of the [35S]Met-puromycin dipeptide was followed using cation-exchange TLC. A kinetic analysis in which a single concentration (50 μM) of phyllanthoside and nagilactone C was used in the Met-puromycin assay is shown. The positions of migration of [35S]Met-tRNAi, free [35S]-methionine, and the [35S]Met-puromycin dipeptide product are indicated. (B) Dose response curve showing the effect of nagilactone C concentration on [35S]Met-puromycin production. Each point represents the average of three experiments, along with the standard deviation.
Similar articles
- Chlorolissoclimides: new inhibitors of eukaryotic protein synthesis.
Robert F, Gao HQ, Donia M, Merrick WC, Hamann MT, Pelletier J. Robert F, et al. RNA. 2006 May;12(5):717-25. doi: 10.1261/rna.2346806. Epub 2006 Mar 15. RNA. 2006. PMID: 16540697 Free PMC article. - Structure-activity relationships of quassinoids for eukaryotic protein synthesis.
Fukamiya N, Lee KH, Muhammad I, Murakami C, Okano M, Harvey I, Pelletier J. Fukamiya N, et al. Cancer Lett. 2005 Mar 18;220(1):37-48. doi: 10.1016/j.canlet.2004.04.023. Cancer Lett. 2005. PMID: 15737686 - Natural products as drugs and tools for influencing core processes of eukaryotic mRNA translation.
Burgers LD, Fürst R. Burgers LD, et al. Pharmacol Res. 2021 Aug;170:105535. doi: 10.1016/j.phrs.2021.105535. Epub 2021 May 29. Pharmacol Res. 2021. PMID: 34058326 Review. - Toxins that inhibit host protein synthesis.
Obrig TG. Obrig TG. Methods Enzymol. 1994;235:647-56. doi: 10.1016/0076-6879(94)35178-3. Methods Enzymol. 1994. PMID: 8057934 Review. - Inhibitors of protein synthesis identified by a high throughput multiplexed translation screen.
Novac O, Guenier AS, Pelletier J. Novac O, et al. Nucleic Acids Res. 2004 Feb 9;32(3):902-15. doi: 10.1093/nar/gkh235. Print 2004. Nucleic Acids Res. 2004. PMID: 14769948 Free PMC article.
Cited by
- Development of a robust cytopathic effect-based high-throughput screening assay to identify novel inhibitors of dengue virus.
McCormick KD, Liu S, Jacobs JL, Marques ET Jr, Sluis-Cremer N, Wang T. McCormick KD, et al. Antimicrob Agents Chemother. 2012 Jun;56(6):3399-401. doi: 10.1128/AAC.06425-11. Epub 2012 Mar 5. Antimicrob Agents Chemother. 2012. PMID: 22391547 Free PMC article. - Anticancer Activities and Mechanism of Action of Nagilactones, a Group of Terpenoid Lactones Isolated from Podocarpus Species.
Bailly C. Bailly C. Nat Prod Bioprospect. 2020 Dec;10(6):367-375. doi: 10.1007/s13659-020-00268-8. Epub 2020 Oct 9. Nat Prod Bioprospect. 2020. PMID: 33034879 Free PMC article. Review. - Mirror-image organometallic osmium arene iminopyridine halido complexes exhibit similar potent anticancer activity.
Fu Y, Soni R, Romero MJ, Pizarro AM, Salassa L, Clarkson GJ, Hearn JM, Habtemariam A, Wills M, Sadler PJ. Fu Y, et al. Chemistry. 2013 Nov 4;19(45):15199-209. doi: 10.1002/chem.201302183. Epub 2013 Sep 23. Chemistry. 2013. PMID: 24114923 Free PMC article. - Organometallic Iridium(III) anticancer complexes with new mechanisms of action: NCI-60 screening, mitochondrial targeting, and apoptosis.
Hearn JM, Romero-Canelón I, Qamar B, Liu Z, Hands-Portman I, Sadler PJ. Hearn JM, et al. ACS Chem Biol. 2013;8(6):1335-43. doi: 10.1021/cb400070a. Epub 2013 Apr 25. ACS Chem Biol. 2013. PMID: 23618382 Free PMC article. - Chlorolissoclimides: new inhibitors of eukaryotic protein synthesis.
Robert F, Gao HQ, Donia M, Merrick WC, Hamann MT, Pelletier J. Robert F, et al. RNA. 2006 May;12(5):717-25. doi: 10.1261/rna.2346806. Epub 2006 Mar 15. RNA. 2006. PMID: 16540697 Free PMC article.
References
- Abid, M.R., Li, Y., Anthony, C., and DeBenedetti, A. 1999. Translational regulation of ribonucletide reductase by eukaryotic initiation factor 4E links protein synthesis to control of DNA replication. J. Biol. Chem. 274: 35991–35998. - PubMed
- Adachi, H., Nishimura, Y., and Takeuchi T. 2002. Synthesis and activities of bactobolin derivatives having new functionality at C-3. J. Antibiot. 55: 92–98. - PubMed
- Ahuja, D., Vera, M.D., SirDeshpande, B.V., Morimoto, H., Williams, P.G., Joullie, M.M., and Toogood, P.L. 2000. Inhibition of protein synthesis by didemnin B: How EF-1α mediates inhibition of translocation. Biochemistry 39: 4339–4346. - PubMed
- Anand, N., Murthy, S., Amann, G., Wernick, M., Porter, L.A., Cukier, I.H., Collins, C., Gray, J.W., Diebold, J., Demetrick, D.J., et al. 2002. Protein elongation factor EEF1A2 is a putative oncogene in ovarian cancer. Nat. Genet. 31: 301–305. - PubMed
- Ayuso, M.S. and Heredia, C.F. 1968. Guanosine trisphosphate dependent enzymic binding of aminoacyl transfer ribonucleic acid to yeast ribosomes. Eur. J. Biochem. 7: 111–118. - PubMed
Publication types
MeSH terms
Substances
LinkOut - more resources
Full Text Sources
Other Literature Sources


