Requirements for CEACAMs and cholesterol during murine coronavirus cell entry - PubMed (original) (raw)
Requirements for CEACAMs and cholesterol during murine coronavirus cell entry
Edward B Thorp et al. J Virol. 2004 Mar.
Abstract
Previous reports have documented that cholesterol supplementations increase cytopathic effects in tissue culture and also intensify in vivo pathogenicities during infection by the enveloped coronavirus murine hepatitis virus (MHV). To move toward a mechanistic understanding of these phenomena, we used growth media enriched with methyl-beta-cyclodextrin or cholesterol to reduce or elevate cellular membrane sterols, respectively. Cholesterol depletions reduced plaque development 2- to 20-fold, depending on the infecting MHV strain, while supplementations increased susceptibility 2- to 10-fold. These various cholesterol levels had no effect on the binding of viral spike (S) proteins to cellular carcinoembryonic antigen-related cell adhesion molecule (CEACAM) receptors, rather they correlated directly with S-protein-mediated membrane fusion activities. We considered whether cholesterol was indirectly involved in membrane fusion by condensing CEACAMs into "lipid raft" membrane microdomains, thereby creating opportunities for simultaneous binding of multiple S proteins that subsequently cooperate in the receptor-triggered membrane fusion process. However, the vast majority of CEACAMs were solubilized by cold Triton X-100 (TX-100), indicating their absence from lipid rafts. Furthermore, engineered CEACAMs appended to glycosylphosphatidylinositol anchors partitioned with TX-100-resistant lipid rafts, but cells bearing these raft-associated CEACAMs were not hypersensitive to MHV infection. These findings argued against the importance of cholesterol-dependent CEACAM localizations into membrane microdomains for MHV entry, instead suggesting that cholesterol had a more direct role. Indeed, we found that cholesterol was required even for those rare S-mediated fusions taking place in the absence of CEACAMs. We conclude that cholesterol is an essential membrane fusion cofactor that can act with or without CEACAMs to promote MHV entry.
Figures
FIG. 1.
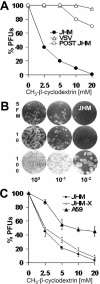
Quantification of virus titer on cells pretreated with MβCD or cholesterol-MβCD inclusion complexes. 17 cl 1 cell monolayers were incubated in SFM with the indicated doses of MβCD (A and C) or cholesterol-MβCD complexes (in micrograms per milliliter) (B) for 30 min at 37°C. Cells were subsequently rinsed and overlaid with serial dilutions of the MHV strain JHM, JHM-X, or A59 or with VSV. In one experiment shown in panel A, MβCD was added after JHM adsorption for 30 min. The number of PFU was determined after 3 days. Error bars represent the standard deviations of the means for two independent determinations.
FIG. 2.
MHV-cell binding after cholesterol extraction or supplementation. HeLa (−) and HeLa-CEACAM (+) cells were cultured in SFM with the indicated doses of MβCD (CD) or cholesterol-MβCD (CHOL) complexes for 30 min at 37°C. Cells were subsequently rinsed and incubated at 4°C for 2 h with 35S-labeled MHV strain A59 (∼5 × 10⁵ cpm). Unadsorbed virions were rinsed away, and cell-associated radioactivity was calculated as a percentage of the total 35S-labeled virus added.
FIG. 3.
Microscopic depictions (A and B) and quantification (C) of MHV-induced syncytia after cholesterol enrichment or depletion. (A and B) HeLa-CEACAM cells were incubated in SFM containing the indicated concentrations of MβCD (CD) or cholesterol (CHOL) for 30 min at 37°C, rinsed with PBS, incubated for 3 h with MHV strain A59 (MOI, ∼10), and then photographed using phase-contrast (A) or fluorescence (B) microscopy. In panel B, cells were labeled with the fluorescent cytosolic dye CMFDA. Bars, 200 μm. (C) The indicated doses of CD and cholesterol (chol) were incubated with HeLa-CEACAM cells that had been prepared for cell fusion-dependent reporter gene activation, as described in Materials and Methods. Cells were rinsed with PBS, A59 virions were applied (MOI, ∼10), and reporter gene product β-galactosidase enzyme activities in lysates were quantified by measuring CPRG substrate turnover at an optical density of 590 nm (OD 590).
FIG. 4.
Distribution of CEACAMs after cell fractionation in 1% TX-100-containing sucrose gradients. HeLa-CEACAM cells were chilled to 4°C and dissolved in 1% TX-100. Postnuclear supernatants were adjusted to 40% sucrose and layered underneath 30 and 5% sucrose. Samples were spun to equilibrium, and CEACAMs in gradient fractions were detected by Western immunoblotting using CEACAM antiserum. The positions of the molecular mass markers (in kilodaltons) are indicated to the right of the blot. The distributions of ganglioside GM1 and transferrin receptor were identified using cholera toxin-peroxidase and antitransferrin antibodies, respectively. TfR, transferrin receptor.
FIG. 5.
Distribution of CEACAMs in 0.2% TX-100-containing sucrose gradients after cholesterol enrichment or depletion. (A) CEACAM distributions were determined as described in the legend to Fig. 4, except that prior to addition of detergent, cell monolayers were cultured for 30 min with either 100 μg of cholesterol (CHOL) per ml or 10 mM CD, as indicated. The positions of molecular mass markers (in kilodaltons) are indicated to the right of the blot. TfR, transferrin receptor. (B) To identify cell surface CEACAMs in flotation gradients, 35S-labeled S1 was bound to cells prior to detergent extraction and processing as described above. In parallel, cells labeled overnight with [3H]cholesterol were chilled and processed as described above to determine the distribution of cholesterol in gradient fractions. 35S-labeled S1-specific and [3H]cholesterol radioactivity was determined by scintillation counting (counts shown as 103 cpm or 103 disintegrations per minute [DPM]). (C) HeLa CEACAM cells were cultured for 30 min in SFM alone or in SFM supplemented with 100 μg of cholesterol (CHOL) per ml or 10 mM CD, rinsed, and then infected with MHV-JHM. Plaques were stained with crystal violet 3 days postinfection.
FIG. 6.
Construction and characterization of HeLa-CEACAMGPI cells. (A) Linear depiction of CEACAMTM and CEACAMGPI. The predicted TM span sequence is underlined, as is the signal peptide containing the omega sequences conferring en bloc attachment of GPI lipid. The carboxy-terminal sequences of the constructs were determined as indicated. (B) Surface fluorescence intensities of HeLa-CEACAMTM (TM) and HeLa-CEACAMGPI (GPI) cells. Flow cytometry profiles of cell surface CEACAMs were determined by indirect immunofluorescence using CEACAM antiserum. (C) Quantification of 35S-labeled MHV binding to HeLa cells lacking CEACAMs and to HeLa cells bearing TM- and GPI-anchored CEACAMs. Binding assays were additionally performed after the cells were treated with PI-PLC. The blots at the bottom of panel C depict CEACAMs in media after the cells were incubated with PI-PLC (+). The position of the 110-kilodalton molecular mass marker is indicated to the right of the GPI blot.
FIG. 7.
Distribution of cell surface CEACAMGPI in 1% TX-100-containing sucrose gradients. Cell surface proteins were biotinylated, and cells were then treated with cold 1% TX-100. Extracts were fractionated in sucrose gradients, biotinylated proteins were captured from gradient fractions with streptavidin-agarose, and TM- and GPI-anchored CEACAMs were visualized by immunoblotting after SDS-polyacrylamide gel electrophoresis. The position of the 110-kilodalton molecular mass marker is indicated to the right of the blot.
FIG. 8.
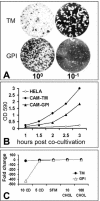
Susceptibility of HeLa-CEACAMGPI cells to infection and membrane fusion. (A) HeLa-CEACAMTM (TM) and HeLa-CEACAMGPI (GPI) cells were infected with serial 10-fold dilutions of MHV-JHM, and plaques were subsequently visualized. (B) HeLa, HeLa-CEACAMTM (CAM-TM), or HeLa-CEACAMGPI (CAM-GPI) target cells were cocultivated with S-bearing effector cells. At 30-min intervals, the cells in the cocultures were lysed, and cell fusion-activated β-galactosidase enzyme activity in the lysate was quantified by measuring CPRG substrate turnover at an optical density of 590 nm (OD 590). (C) Cells bearing either TM- or GPI-anchored receptors were cultivated in CD (5 or 10 mM) or cholesterol (CHOL) (10 or 100 μg/ml) for 30 min at 37°C. Monolayers were subsequently rinsed, and infectivity was determined by plaque assay. The fold difference in PFU/ml was calculated relative to cells cultured in SFM alone.
FIG. 9.
CEACAM-independent fusion after cholesterol extraction. (A) Photos of R18-labeled target cells 3 h after the cells were cocultivated with unlabeled S-bearing (JHM) effector cells. In the rightmost panel, a parallel culture was treated with 5 mM MβCD for 30 min at 37°C and rinsed prior to cocultivation. Bar, 50 μm. (B) Bar graph showing [3H]cholesterol (CHOL) levels in cells (hatched bars) and media (black bars) after exposure to the indicated millimolar concentrations of MβCD (30 min at 37°C). Cells were previously labeled for 18 h with [3H]cholesterol. After CD treatments, media were removed, cells were lysed, and 3H levels (in disintegrations per minute [DPM]) were determined by scintillation counting. (C) HeLa target cells were treated with Lipofectamine with pTM3-eGFP and then treated with MβCD as described for panel B. Target cells were then overlaid with effector cells presenting SJHM. In this assay, eGFP gene expression is dependent on effector cell-target cell fusion. Micrographs were taken 3 h after cocultivation of effector and target cells. Bar, 100 μm.
Similar articles
- Identification of H209 as Essential for pH 8-Triggered Receptor-Independent Syncytium Formation by S Protein of Mouse Hepatitis Virus A59.
Li P, Shan Y, Zheng W, Ou X, Mi D, Mu Z, Holmes KV, Qian Z. Li P, et al. J Virol. 2018 May 14;92(11):e00209-18. doi: 10.1128/JVI.00209-18. Print 2018 Jun 1. J Virol. 2018. PMID: 29514915 Free PMC article. - Murine coronavirus requires lipid rafts for virus entry and cell-cell fusion but not for virus release.
Choi KS, Aizaki H, Lai MM. Choi KS, et al. J Virol. 2005 Aug;79(15):9862-71. doi: 10.1128/JVI.79.15.9862-9871.2005. J Virol. 2005. PMID: 16014947 Free PMC article. - N-terminal domain of the murine coronavirus receptor CEACAM1 is responsible for fusogenic activation and conformational changes of the spike protein.
Miura HS, Nakagaki K, Taguchi F. Miura HS, et al. J Virol. 2004 Jan;78(1):216-23. doi: 10.1128/jvi.78.1.216-223.2004. J Virol. 2004. PMID: 14671103 Free PMC article. - MHVR-independent cell-cell spread of mouse hepatitis virus infection requires neutral pH fusion.
Nash TC, Gallagher TM, Buchmeier MJ. Nash TC, et al. Adv Exp Med Biol. 1995;380:351-7. doi: 10.1007/978-1-4615-1899-0_57. Adv Exp Med Biol. 1995. PMID: 8830507 Review. - Modulation of entry of enveloped viruses by cholesterol and sphingolipids (Review).
Rawat SS, Viard M, Gallo SA, Rein A, Blumenthal R, Puri A. Rawat SS, et al. Mol Membr Biol. 2003 Jul-Sep;20(3):243-54. doi: 10.1080/0968768031000104944. Mol Membr Biol. 2003. PMID: 12893532 Review.
Cited by
- Cholesterol dependence of Newcastle Disease Virus entry.
Martín JJ, Holguera J, Sánchez-Felipe L, Villar E, Muñoz-Barroso I. Martín JJ, et al. Biochim Biophys Acta. 2012 Mar;1818(3):753-61. doi: 10.1016/j.bbamem.2011.12.004. Epub 2011 Dec 13. Biochim Biophys Acta. 2012. PMID: 22192779 Free PMC article. - Beta-coronaviruses exploit cellular stress responses by modulating TFEB and TFE3 activity.
Contreras PS, Tapia PJ, Jeong E, Ghosh S, Altan-Bonnet N, Puertollano R. Contreras PS, et al. iScience. 2023 Mar 17;26(3):106169. doi: 10.1016/j.isci.2023.106169. Epub 2023 Feb 9. iScience. 2023. PMID: 36785787 Free PMC article. - Non-Targeted Metabolomic Analysis of Chicken Kidneys in Response to Coronavirus IBV Infection Under Stress Induced by Dexamethasone.
Dai J, Wang H, Liao Y, Tan L, Sun Y, Song C, Liu W, Ding C, Luo T, Qiu X. Dai J, et al. Front Cell Infect Microbiol. 2022 Jul 15;12:945865. doi: 10.3389/fcimb.2022.945865. eCollection 2022. Front Cell Infect Microbiol. 2022. PMID: 35909955 Free PMC article. - Cholesterol-Rich Lipid Rafts as Platforms for SARS-CoV-2 Entry.
Palacios-Rápalo SN, De Jesús-González LA, Cordero-Rivera CD, Farfan-Morales CN, Osuna-Ramos JF, Martínez-Mier G, Quistián-Galván J, Muñoz-Pérez A, Bernal-Dolores V, Del Ángel RM, Reyes-Ruiz JM. Palacios-Rápalo SN, et al. Front Immunol. 2021 Dec 16;12:796855. doi: 10.3389/fimmu.2021.796855. eCollection 2021. Front Immunol. 2021. PMID: 34975904 Free PMC article. Review.
References
- Acarturk, F., T. Imai, H. Saito, M. Ishikawa, and M. Otagiri. 1993. Comparative study on inclusion complexation of maltosyl-beta-cyclodextrin, heptakis(2,6-di-O-methyl)-beta-cyclodextrin and beta-cyclodextrin with fucosterol in aqueous and solid state. J. Pharm. Pharmacol. 45:1028-1032. - PubMed
- Amundson, D. M., and M. Zhou. 1999. Fluorometric method for the enzymatic determination of cholesterol. J. Biochem. Biophys. Methods 38:43-52. - PubMed
Publication types
MeSH terms
Substances
LinkOut - more resources
Full Text Sources
Other Literature Sources
Medical


