Viral targeting of hematopoietic progenitors and inhibition of DC maturation as a dual strategy for immune subversion - PubMed (original) (raw)
Viral targeting of hematopoietic progenitors and inhibition of DC maturation as a dual strategy for immune subversion
Noemí Sevilla et al. J Clin Invest. 2004 Mar.
Abstract
DCs play a pivotal role in bringing forth innate and adaptive immune responses. Viruses can specifically target DCs, rendering them ineffective in stimulating T cells, which can ultimately lead to immunosuppression. In the present study we have identified several potential mechanisms by which lymphocytic choriomeningitis virus (LCMV) induces immunosuppression in its natural murine host. The immunosuppressive LCMV variant clone 13 (Cl 13) infects DCs and interferes with their maturation and antigen-presenting capacity as evidenced by a significant reduction in the surface expression of MHC class I, MHC class II, CD40, CD80, and CD86 molecules. Additionally, Cl 13 infects hematopoietic progenitor cells both in vivo and in vitro, impairing their development. One mechanism by which hematopoietic progenitors are developmentally impaired is through the Cl 13-induced production of IFN-alpha and IFN-beta (IFN-alpha/beta). Mice deficient in the receptor for IFN-alpha/beta show a normal differentiation of progenitors into DCs despite viral infection. Thus, a virus can evolve a strategy to boost its survival by preventing the maturation of DCs from infected progenitor cells and by reducing the expression of antigen-presenting and costimulatory molecules on developed DCs.
Figures
Figure 1
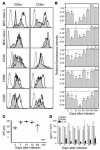
LCMV Cl 13 infection reduces the expression of cell surface molecules on splenic DCs. Labeling with anti-CD11c and -CD80 antibodies was used to distinguish between CD11c+CD8α+ and CD11c+CD8α– DCs. (A) Histograms show one of four representative experiments analyzing the expression of cell surface molecules on CD11c+CD8α+ and CD11c+CD8α– spleen DCs from Cl 13– or ARM-infected mice at day 15 after infection. Dotted histograms indicate background staining with isotype control antibodies, white histograms represent ARM-infected mice, and shaded histograms represent Cl 13–infected mice. (B) The RFI of surface molecules expressed on CD11c+CD8α+ splenic DCs from day 3 to day 360 after infection is displayed. Each bar represents the RFI of a given surface molecule on CD11c+CD8α+ spleen DCs. The RFI was calculated as indicated in Methods. Data are presented as mean ± SD. Asterisks denote a statistically significant reduction in Cl 13–infected mice compared with ARM-infected mice (Student t test, P < 0.05). (C) Viral load in serum of 5–8 Cl 13–infected mice analyzed from day 3 to day 120 after infection as determined by plaque assay. Each filled circle represents an individual mouse. The line at each timepoint represents the mean of all mice in each group. (D) The allostimulatory capacity of DCs from the spleens of either uninfected (white bars), ARM-infected (gray bars), or Cl 13–infected (black bars) mice is indicated at different timepoints after infection. DCs from infected or uninfected C57BL/6 (H-2b) mice were irradiated and used as stimulator cells for allogeneic T cells from BALB/c (H-2d) mice at a T cell/DC ratio of 5:1 in the MLR. Proliferation was measured in cpm (average cpm ± SD) after [3H]thymidine incorporation. Each bar represents the average of at least four mice.
Figure 2
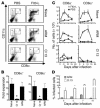
Splenic CD8α+ and CD8α– DCs do not expand after Flt3-L treatment in Cl 13–infected mice. (A) Dot plots show double staining for CD11c and CD8α molecules on splenocytes from mice treated with Flt3-L or PBS, which was initiated at day 15 after infection. Boxes labeled a denote CD11c+CD8α– (myeloid) DCs, and boxes labeled b denote CD11c+CD8α+ (lymphoid) DCs. (B) The fold expansion of CD11c+CD8α+ (boxes labeled b) and CD11c+CD8α– (boxes labeled a) DCs is plotted for naive, Cl 13–infected, and ARM-infected mice, calculated as indicated in Methods. (C) DCs were isolated from spleens of mice that were treated with either PBS (filled squares) or Flt3-L (open triangles) for 15 days. The treatment began 5 days prior to infection and continued for an additional 10 days. Mice were sacrificed at days 0, 5, 10, and 15 after infection. Day 0 after infection corresponds to day 5 of Flt3-L treatment, and day 10 after infection represents the end of Flt3-L treatment. Flow cytometric analyses were performed to determine the number of splenic CD11c+CD8α– (myeloid) and CD11c+CD8α+ (lymphoid) DCs. The populations were gated as shown in Figure 3A. The absolute number of CD11c+CD8α– and CD11c+CD8α+ DCs are plotted for naive, ARM-infected, and Cl 13–infected mice. The data are representative of two independent experiments using nine mice per group. (D) The percentage of infected BMCs was calculated at days 3, 5, 7, and 15 after infection in Cl 13–infected (white bars) and ARM-infected (gray bars) mice. BMCs were harvested at the indicated timepoints, stained with an LCMV NP–specific antibody directly conjugated to Alexa 488, and analyzed by flow cytometry.
Figure 3
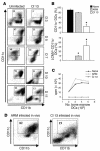
Cl 13 infection of BMCs in vitro inhibits the generation of CD11c+ DCs. (A) Dot plots show CD11c and CD11b expression for uninfected and Cl 13–infected BMCs at days 3, 5, 7, 10, and 11 of culture with GM-CSF. The boxes denote the percentage of CD11c+ DCs in the cultures. Note the reduction in the percentage of CD11c+ cells in Cl 13–infected cultures when compared with uninfected cultures at all timepoints. The data shown are representative of five independent experiments. (B) The percentage of CD11c+ cells as well as the percentage of LCMV-infected CD11c+ cells is plotted for uninfected, ARM-infected, or Cl 13–infected cultures at day 11. Data are represented as the mean ± SD. Statistical differences were determined using a one-way ANOVA (P < 0.05). Asterisks denote a statistical difference from uninfected cultures. (C) The allostimulatory capacity of uninfected, ARM-infected, or Cl 13–infected BM DCs was evaluated at day 11 after culture. Log-serial dilutions (ranging from 102 to 105) of DCs were irradiated and used as stimulator cells for allogeneic T cells from BALB/c (H-2d) mice at a T cell/DC ratio of 5:1 in the MLR. Proliferation was measured in cpm after [3H]thymidine incorporation. (D) Fresh BMCs were isolated from Cl 13– or ARM-infected mice at day 15 after infection and grown for 11 days in the presence of GM-CSF. Dot plots show CD11c and CD11b expression. The boxes denote the percentage of CD11c+ DCs in the cultures.
Figure 4
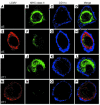
Cl 13 infection inhibits the expression of MHC class II molecules on CD11c+ DCs. Confocal microscopy was used to analyze the expression of MHC class II molecules (green), CD11c (blue), and viral NP (red) on BMCs stimulated with GM-CSF in vitro. LCMV indicates cells infected with Cl 13. Panels A–D show uninfected BMCs after 5 days of culture. The same timepoint is shown in panels E–H for Cl 13–infected cells. Note the perinuclear distribution of MHC class II in uninfected DCs at day 5. A similar distribution was observed in Cl 13–infected DCs at this timepoint; however, the intensity of staining was significantly reduced. At day 11, MHC class II was detected on the plasma membrane of CD11c+ DCs in the uninfected cultures (I–L) but not on Cl 13–infected DCs (M–P). The micrographs are representative of at least three independent experiments in which a minimum of ten DCs was analyzed.
Figure 5
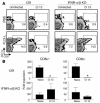
IFN-α/βR0/0 mice infected with Cl 13 expand DCs in response to Flt3-L treatment. Splenic DCs were isolated from uninfected or Cl 13–infected IFN-α/βR0/0 and 129/SvEv mice treated for 10 days with Flt3-L (see Figure 3). The Flt3-L treatment was initiated at day 15 after infection. (A) Dot plots show CD11c+CD8α+ and CD11c+CD8α– DCs in mice treated with PBS or Flt3-L. Boxes denote the percentage of CD11c+CD8α+ DCs. Note the normal expansion of CD11c+CD8α+ DCs in Flt3-L–treated IFN-α/βR0/0 mice infected with Cl 13. (B) The fold expansion of both CD11c+CD8α+ and CD11c+CD8α– DCs is plotted for naive and Cl 13–infected mice. The fold expansion was calculated by dividing the absolute number of each DC subset in Flt3-L–treated mice by the absolute number of cells in PBS-treated mice. Data are presented as the mean ± SD. Statistical differences denoted by asterisks were determined using a Student t test (P < 0.05).
Comment in
- Viral immunosuppression: disabling the guards.
Colonna M. Colonna M. J Clin Invest. 2004 Mar;113(5):660-2. doi: 10.1172/JCI21166. J Clin Invest. 2004. PMID: 14991061 Free PMC article.
Similar articles
- Infection of dendritic cells by lymphocytic choriomeningitis virus.
Sevilla N, Kunz S, McGavern D, Oldstone MB. Sevilla N, et al. Curr Top Microbiol Immunol. 2003;276:125-44. doi: 10.1007/978-3-662-06508-2_6. Curr Top Microbiol Immunol. 2003. PMID: 12797446 Free PMC article. Review. - Multifront assault on antigen presentation by Japanese encephalitis virus subverts CD8+ T cell responses.
Aleyas AG, Han YW, George JA, Kim B, Kim K, Lee CK, Eo SK. Aleyas AG, et al. J Immunol. 2010 Aug 1;185(3):1429-41. doi: 10.4049/jimmunol.0902536. Epub 2010 Jun 25. J Immunol. 2010. PMID: 20581148 - Type I interferon limits the capacity of bluetongue virus to infect hematopoietic precursors and dendritic cells in vitro and in vivo.
Rodríguez-Calvo T, Rojas JM, Martín V, Sevilla N. Rodríguez-Calvo T, et al. J Virol. 2014 Jan;88(2):859-67. doi: 10.1128/JVI.02697-13. Epub 2013 Oct 30. J Virol. 2014. PMID: 24173228 Free PMC article. - In vitro hematopoiesis reveals a novel dendritic-like cell present in murine spleen.
Periasamy P, O'Neill HC. Periasamy P, et al. Curr Stem Cell Res Ther. 2013 Sep;8(5):365-9. doi: 10.2174/1574888x113089990050. Curr Stem Cell Res Ther. 2013. PMID: 23971833 Review.
Cited by
- Reinvigorating exhausted HIV-specific T cells via PD-1-PD-1 ligand blockade.
Freeman GJ, Wherry EJ, Ahmed R, Sharpe AH. Freeman GJ, et al. J Exp Med. 2006 Oct 2;203(10):2223-7. doi: 10.1084/jem.20061800. Epub 2006 Sep 25. J Exp Med. 2006. PMID: 17000870 Free PMC article. Review. - Viral immunosuppression: disabling the guards.
Colonna M. Colonna M. J Clin Invest. 2004 Mar;113(5):660-2. doi: 10.1172/JCI21166. J Clin Invest. 2004. PMID: 14991061 Free PMC article. - The fate of effector CD8 T cells in vivo is controlled by the duration of antigen stimulation.
Huang X, Yang Y. Huang X, et al. Immunology. 2006 Jul;118(3):361-71. doi: 10.1111/j.1365-2567.2006.02381.x. Immunology. 2006. PMID: 16827897 Free PMC article. - The role of polyspecific T-cell exhaustion in severe outcomes for COVID-19 patients having latent pathogen infections such as Toxoplasmagondii.
Roe K. Roe K. Microb Pathog. 2021 Dec;161(Pt B):105299. doi: 10.1016/j.micpath.2021.105299. Epub 2021 Nov 20. Microb Pathog. 2021. PMID: 34813900 Free PMC article. - Immune Exhaustion: Past Lessons and New Insights from Lymphocytic Choriomeningitis Virus.
Kahan SM, Zajac AJ. Kahan SM, et al. Viruses. 2019 Feb 13;11(2):156. doi: 10.3390/v11020156. Viruses. 2019. PMID: 30781904 Free PMC article. Review.
References
- Bancahereau J, Steinman RM. Dendritic cells and the control of immunity. Nature. 1998;392:245–252. - PubMed
- Steinman RM. The dendritic cell system and its role in immunogenicity. Annu. Rev. Immunol. 1991;9:271–296. - PubMed
- Knight SC, Patterson S. Bone marrow-derived dendritic cells, infection with human immunodeficiency virus, and immunopathology. Annu. Rev. Immunol. 1997;15:593–615. - PubMed
Publication types
MeSH terms
Substances
Grants and funding
- T32 AG000080/AG/NIA NIH HHS/United States
- AI45927/AI/NIAID NIH HHS/United States
- R01 AI045927/AI/NIAID NIH HHS/United States
- AI09484/AI/NIAID NIH HHS/United States
- R01 AI009484/AI/NIAID NIH HHS/United States
- AG-00080/AG/NIA NIH HHS/United States
LinkOut - more resources
Full Text Sources
Other Literature Sources
Medical
Research Materials
