Identification and handling of artifactual gene expression profiles emerging in microarray hybridization experiments - PubMed (original) (raw)
Comparative Study
Identification and handling of artifactual gene expression profiles emerging in microarray hybridization experiments
Leonid Brodsky et al. Nucleic Acids Res. 2004.
Abstract
Mathematical methods of analysis of microarray hybridizations deal with gene expression profiles as elementary units. However, some of these profiles do not reflect a biologically relevant transcriptional response, but rather stem from technical artifacts. Here, we describe two technically independent but rationally interconnected methods for identification of such artifactual profiles. Our diagnostics are based on detection of deviations from uniformity, which is assumed as the main underlying principle of microarray design. Method 1 is based on detection of non-uniformity of microarray distribution of printed genes that are clustered based on the similarity of their expression profiles. Method 2 is based on evaluation of the presence of gene-specific microarray spots within the slides' areas characterized by an abnormal concentration of low/high differential expression values, which we define as 'patterns of differentials'. Applying two novel algorithms, for nested clustering (method 1) and for pattern detection (method 2), we can make a dual estimation of the profile's quality for almost every printed gene. Genes with artifactual profiles detected by method 1 may then be removed from further analysis. Suspicious differential expression values detected by method 2 may be either removed or weighted according to the probabilities of patterns that cover them, thus diminishing their input in any further data analysis.
Figures
Figure 1
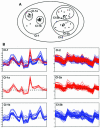
Nested clustering of gene expression profiles. (A) Two-dimensional representation of the nested clustering procedure. The gene expression profiles are shown as separate points in a two-dimensional space. Higher level cluster 1 (Cl-1) contains two compact lower level clusters, Cl-1a and Cl-1b. Higher level cluster 2 (Cl-2) contains two poorly separated lower level clusters, Cl-2a and Cl-2b. (B) Actual expression profiles of genes included in Cl-1 and 2. The _x_-axis shows the hybridization experiments and the _y_-axis shows the ln of values of differential expression. See text for details.
Figure 2
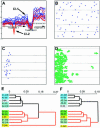
Automatic identification of patterns using a city-block distance. (A) An example of the distribution of differential expression values over a slide. Yellow, blue and pink spots have differential expression values belonging to high value (>2), low value (<0.5) or intermediate value intervals, respectively. Semi-transparent rhombi represent some of the optimal city-block neighborhoods of spots with high values of differentials. The interconnected union of these rhombi constitutes a ‘pattern zone’. (B) Detected pattern of high differentials; the spots with high differential expression values that were covered by a detected ‘pattern zone’.
Figure 3
Uniformity versus non-uniformity of cluster distribution over the microarray. (A and C) Examples of gene clusters (cluster A and cluster B) detected in the same microarray experiment consisting of 15 hybridizations. The probes for hybridizations 1–6 were derived from cells subjected to ‘treatment 1’ in a time-course manner. Hybridizations 7–14 relate to a time-course treatment of the same cells with another agent (‘treatment 2’). Hybridization 15 represents untreated control cells. The _x_-axis shows hybridization experiments and the _y_-axis shows the ln of values of differential expression. (B) Microarray distribution of spots corresponding to the genes included in cluster A. (D) Microarray distribution of spots corresponding to the genes included in cluster B.
Figure 4
Influence of gene sorting according to the KS criterion of biological quality on hierarchical clustering of probes. (A) Hierarchical clustering of probes within the hybridization set according to gene expression profiles of all 10 000 genes printed on the microarray. (B) Hierarchical clustering of probes within the same hybridization set according to expression profiles of 6283 genes with a median KS _P_-value ≥0.2, predicted to have biological expression profiles. (C) Hierarchical clustering of probes within the same hybridization set according to expression profiles of 1847 genes with a median KS _P_-value ≤0.001 predicted to have artifactual expression profiles. Probes: A1, PDGFβ 1 ng/ml; A2, PDGFβ 10 ng/ml; B1, TGFβ 1 ng/ml; B2, TGFβ 10 ng/ml; C, hypoxia (0.5% O2, 5% CO2). For details, see text.
Figure 5
Application of weighted measure of distance for clustering of gene expression profiles and hierarchical clustering of hybridizations. (A) A cluster obtained from the application of the weighted clustering procedure represents a combination of two otherwise separated clusters (shown in blue and red). The _x_-axis shows the hybridization probes and the _y_-axis shows the ln of values of differential expression. (B) Microarray distribution of spots corresponding to the genes within the ‘blue’ cluster. (C) Microarray distribution of spots corresponding to the genes within the ‘red’ cluster. (D) Pattern of low differentials on the slide corresponding to probe 8. (E) Hierarchical clustering of probes within the hybridization set according to gene expression profiles of all 10 000 genes printed on the microarray (same as shown in Fig. 4A). (F) Hierarchical clustering of the same hybridization set using a weighted measure of distance, based on the expression profiles of all 10 000 printed genes. Note the improvement of the probe clustering in accordance with the underlying biological conditions (for details, see the text and the legend to Fig. 4).
Figure 6
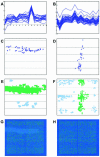
Coincidence of microarray distribution of artifactual clusters with the zones of patterns of differential expression values. (A and B) Two gene clusters detected in the same microarray experiment, comprising 15 hybridizations. The _x_-axis shows the hybridization probes and the _y_-axis shows the ln of values of differential expression. (C and D) Microarray distribution of spots corresponding to the genes included in the clusters shown in (A) and (B), respectively. (E and F) Patterns of differentials appearing on the slides corresponding to hybridizations 10 and 2, respectively. The patterns whose position coincides with the microarray distribution of clusters shown in (A) and (B) are colored green. (G and H) Deduced Cy5 microarray images of slides corresponding to hybridizations 10 and 2, respectively.
Similar articles
- A new outlier removal approach for cDNA microarray normalization.
Wu Y, Yan L, Liu H, Sun H, Xie H. Wu Y, et al. Biotechniques. 2009 Aug;47(2):691-2, 694-700. doi: 10.2144/000113195. Biotechniques. 2009. PMID: 19737130 - Profound normalisation challenges remain in the analysis of data from microarray experiments.
Lyons-Weiler J. Lyons-Weiler J. Appl Bioinformatics. 2003;2(4):193-5. Appl Bioinformatics. 2003. PMID: 15130790 No abstract available. - Overcoming confounded controls in the analysis of gene expression data from microarray experiments.
Bhattacharya S, Long D, Lyons-Weiler J. Bhattacharya S, et al. Appl Bioinformatics. 2003;2(4):197-208. Appl Bioinformatics. 2003. PMID: 15130791 - Standards in gene expression microarray experiments.
Salit M. Salit M. Methods Enzymol. 2006;411:63-78. doi: 10.1016/S0076-6879(06)11005-8. Methods Enzymol. 2006. PMID: 16939786 Review. - Maintaining data integrity in microarray data management.
Grant GR, Manduchi E, Pizarro A, Stoeckert CJ Jr. Grant GR, et al. Biotechnol Bioeng. 2003 Dec 30;84(7):795-800. doi: 10.1002/bit.10847. Biotechnol Bioeng. 2003. PMID: 14708120 Review.
Cited by
- SimArray: a user-friendly and user-configurable microarray design tool.
Auburn RP, Russell RR, Fischer B, Meadows LA, Sevillano Matilla S, Russell S. Auburn RP, et al. BMC Bioinformatics. 2006 Mar 1;7:102. doi: 10.1186/1471-2105-7-102. BMC Bioinformatics. 2006. PMID: 16509966 Free PMC article. - Evolutionary regulation of the blind subterranean mole rat, Spalax, revealed by genome-wide gene expression.
Brodsky LI, Jacob-Hirsch J, Avivi A, Trakhtenbrot L, Zeligson S, Amariglio N, Paz A, Korol AB, Band M, Rechavi G, Nevo E. Brodsky LI, et al. Proc Natl Acad Sci U S A. 2005 Nov 22;102(47):17047-52. doi: 10.1073/pnas.0505043102. Epub 2005 Nov 14. Proc Natl Acad Sci U S A. 2005. PMID: 16286648 Free PMC article. - Changes in gene expression during pegylated interferon and ribavirin therapy of chronic hepatitis C virus distinguish responders from nonresponders to antiviral therapy.
Taylor MW, Tsukahara T, Brodsky L, Schaley J, Sanda C, Stephens MJ, McClintick JN, Edenberg HJ, Li L, Tavis JE, Howell C, Belle SH. Taylor MW, et al. J Virol. 2007 Apr;81(7):3391-401. doi: 10.1128/JVI.02640-06. Epub 2007 Jan 31. J Virol. 2007. PMID: 17267482 Free PMC article. - Derivation of species-specific hybridization-like knowledge out of cross-species hybridization results.
Bar-Or C, Bar-Eyal M, Gal TZ, Kapulnik Y, Czosnek H, Koltai H. Bar-Or C, et al. BMC Genomics. 2006 May 8;7:110. doi: 10.1186/1471-2164-7-110. BMC Genomics. 2006. PMID: 16677401 Free PMC article.
References
- Brown P.O. and Botstein,D. (1999) Exploring the new world of the genome with DNA microarrays. Nature Genet., 21, 33–37. - PubMed
- Ressom H., Wang,D. and Natarajan,P. (2003) Adaptive double self-organizing maps for clustering gene expression profiles. Neural Networks, 16, 633–640. - PubMed
- Segal E., Shapira,M., Regev,A., Pe’er,D., Botstein,D., Koller,D. and Friedman,N. (2003) Module networks: identifying regulatory modules and their condition-specific regulators from gene expression data. Nature Genet., 34, 166–176. - PubMed
Publication types
MeSH terms
LinkOut - more resources
Full Text Sources
Other Literature Sources


