Cyclase-associated protein 1 (CAP1) promotes cofilin-induced actin dynamics in mammalian nonmuscle cells - PubMed (original) (raw)
Cyclase-associated protein 1 (CAP1) promotes cofilin-induced actin dynamics in mammalian nonmuscle cells
Enni Bertling et al. Mol Biol Cell. 2004 May.
Abstract
Cyclase-associated proteins (CAPs) are highly conserved actin monomer binding proteins present in all eukaryotes. However, the mechanism by which CAPs contribute to actin dynamics has been elusive. In mammals, the situation is further complicated by the presence of two CAP isoforms whose differences have not been characterized. Here, we show that CAP1 is widely expressed in mouse nonmuscle cells, whereas CAP2 is the predominant isoform in developing striated muscles. In cultured NIH3T3 and B16F1 cells, CAP1 is a highly abundant protein that colocalizes with cofilin-1 to dynamic regions of the cortical actin cytoskeleton. Analysis of CAP1 knockdown cells demonstrated that this protein promotes rapid actin filament depolymerization and is important for cell morphology, migration, and endocytosis. Interestingly, depletion of CAP1 leads to an accumulation of cofilin-1 into abnormal cytoplasmic aggregates and to similar cytoskeletal defects to those seen in cofilin-1 knockdown cells, demonstrating that CAP1 is required for proper subcellular localization and function of ADF/cofilin. Together, these data provide the first direct in vivo evidence that CAP promotes rapid actin dynamics in conjunction with ADF/cofilin and is required for several central cellular processes in mammals.
Figures
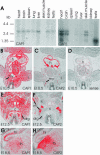
Figure 1.
Expression patterns of mouse CAP1 and CAP2. (A) Northern blot analysis of CAP1 and CAP2 expression in adult mouse tissues. CAP1 (left) is expressed in all tissues except in skeletal muscle. CAP2 (right) is expressed at high levels in heart, brain, skeletal muscle, and testis and is also found in very low levels in lung and liver. The three different RNA populations recognized by the CAP2 probe are most likely a consequence of alternative mRNA processing (see text for details). (B) In situ hybridization on a transversal section of E10.5 mouse embryo shows that CAP1 expression is widespread. (C) Adjacent section shows that CAP2 expression is restricted to heart and developing muscles. (D) Hybridization of an adjacent section with a control CAP1 sense probe does not give significant background. (E) CAP1 is widely expressed at E12.5. (F) CAP2 is restricted to developing striated muscles at E12.5. (G) Elevated CAP1 expression is detected in hippocampus at E18.5. (H) Highest levels of CAP2 in brain is detected in thalamus at E18.5. These expression patterns indicate that CAP1 plays role as a general isoform, whereas CAP2 is a striated muscle specific isoform during early development. c, cartilage; cx, cortex; drg, dorsal root ganglion; h, heart; hi, hippocampus; k; kidney; l, limb; m; muscle; my, myotome; sc, spinal cord; th, thalamus.
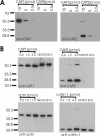
Figure 2.
CAP1 is an abundant protein in NIH3T3 and B16F1 cells. (A) Three different amounts (10, 5, and 2.5 pmol) of purified GST-CAP11–221 (calculated mol. wt. = 51 kDa) and his-tagged CAP21–227 (calculated mol. wt. = 26 kDa) were run on polyacrylamide gels, and the proteins were visualized by Western blotting by using anti-CAP1 (left) or anti-CAP2 (right) antibodies. Purified polyclonal guinea pig anti-CAP1 antibody is specific to CAP1, whereas purified polyclonal rabbit anti-CAP2 antibody only recognizes CAP2. Note that his-tagged CAP21–227 has a small tendency to dimerize on polyacrylamide gels. (B) Mouse NIH3T3 and B16F1 cell extracts and known concentrations of GST-CAP11–221, CAP21–227, β/γ actin, and cofilin-1 were run on polyacrylamide gels, and the proteins were visualized by specific antibodies. CAP2 protein was undetectable in these cells. The CAP1:cofilin-1:β/γ actin ratio in NIH 3T3 and B16F1 cell extracts is ∼1:1:4.
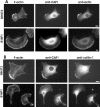
Figure 3.
Localization of CAP1 in NIH3T3 and B16F1 cells. (A) Cells were stained with Alexa488-phalloidin to visualize F-actin (left), with anti-CAP1 antibody (middle), and with AC15 anti-actin antibody to visualize monomeric actin (right). CAP1 localizes to actin-rich regions of cell cortex and behind the leading edge of the lamellae. (B) F-actin (left) and CAP1 (middle) were visualized in NIH 3T3 and B16F1 cells as described above, and cofilin-1 was visualized by an isoform-specific polyclonal cofilin-1 antibody (right). CAP1 and cofilin-1 show clear colocalization at the cortical actin cytoskeletons of these cells. Bar, 10 μm.
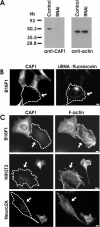
Figure 4.
Depletion of CAP1 by siRNA results in an accumulation of stress-fibers and abnormal morphology in NIH3T3, B16F1, and Neuro2A cells. (A) Western blot analysis demonstrating the CAP1 protein levels in B16F1 control cells and in B16F1 cells transfected with CAP1-specific RNAi oligonucleotide duplex. Equal amounts of cell lysates were run on polyacrylamide gels, and CAP1 (left) and β/γ actin were visualized by Western blotting. (B) Cells transfected with fluorescein-labeled CAP1-siRNA oligonucleotides were stained with anti-CAP1 antibodies. Note, that the cell containing fluorescein-labeled oligonucleotides (arrow) has severely reduced CAP1 levels, whereas the nontransfected cells show normal level of CAP1-staining. (C) siRNA transfected B16F1 (top), NIH3T3 (middle), and Neuro 2A (bottom) cells were stained with anti-CAP1 antibodies (left) and Alexa488-phalloidin (right) to visualize the effect of CAP1 depletion for the actin cytoskeleton. The CAP1 knockdown cells (arrows) showed abnormal accumulation of thick stress-fibers compared with nontransfected wild-type cells. In NIH 3T3 and Neuro 2A cells, the CAP1 depletion also resulted in the loss of membrane ruffles, whereas in B16F1 cells CAP1 depletion resulted in a decreased polarity of existing membrane ruffles. Bar, 10 μm.
Figure 5.
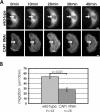
CAP1 is important for cell migration. (A and Supplementary Videos 1 and 2) Representative examples of motilities of wild-type (top) and CAP1 knockdown (bottom) B16F1 cells expressing GFP-actin. White arrows indicate the locations of the nuclei in the first frame. Wild-type cells typically displayed directional migration. CAP1 knockdown cells were capable to extend and retract their lamellipodia, but they were generally unable to migrate to certain direction. Note that also the reorganization of actin filament structures is much slower in CAP1 knockdown cells than in wild-type cells. Bar, 10 μm. (B) Migration of 44 wild-type and 28 CAP1 knockdown B16F1 cells were monitored for 100 min. The average motility distances of wild-type cells and CAP1 knockdown cells were 53.4 and 27.6 μm, respectively. SEM and statistical significance of the data are indicated in the graph.
Figure 6.
Depletion of CAP1 results in defects in receptor-mediated endocytosis. (A) Uptake of transferrin was compared between wild-type and CAP1 knockdown cells. Cells were incubated for 7 min in 20 ng/ml rhodamine-transferrin and stained with anti-CAP1 antibody (left) to visualize CAP1 knockdown cells (white arrow). Depletion of CAP1 from cells resulted in a decrease in transferrin uptake. Instead of strong perinuclear accumulation, transferrin (right) showed uniform punctate cytoplasmic staining in CAP1 knockdown cells. Bar, 10 μm. (B) Intensity of rhodamine-transferrin fluorescence was quantified by TINA software from 20 knockdown cells and compared with the intensity of rhodamine fluorescence of an adjacent wild-type cell from the same frame. In CAP1 knockdown cells, transferrin uptake was reduced to 44% of the one in wild-type cells. SEM = 0.04 and statistical significance of the data (p < 0.001) are indicated in the graph.
Figure 7.
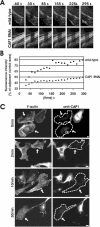
Actin filament assembly and disassembly rates are severely diminished in CAP1 knockdown cells. (A) Actin filament treadmilling rates in wild-type and CAP1 knockdown cells were measured by using FRAP. Selected regions of B16F1 cells expressing GFP-actin were bleached by intense laser irradiation, and recovery of the bleached area was monitored by taking images every 14 s, starting 30 s after bleaching. Figure shows representative example of a wild-type cell (top) and CAP1 knockdown cell (bottom). (B) Rate of the fluorescence recovery was analyzed from the image series by TINA software. In each frame, the fluorescence intensity of the bleached region was compared with the fluorescence of the control region (in same picture next to bleached one) to diminish the error caused by normal photobleaching during the monitoring period. Recovery of the bleached regions in the CAP1 RNAi cells were significantly slower than in wild-type cells. (C) Actin filament depolymerization in wild-type and CAP1 knockdown cells were measured by using actin monomer-sequestering drug latrunculin-A. Cells were treated with 2 μm latrunculin-A, fixed at different time points (0, 2, 10, and 30 min), and F-actin and CAP1 were visualized by immunofluorescence. Actin filament structures were rapidly disrupted in wild-type cells, whereas in CAP1 knockdown cells (arrows) the disappearance of stress-fibers was significantly slower.
Figure 8.
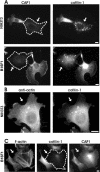
CAP1 is important for correct subcellular localization and function of cofilin-1. (A) NIH 3T3 (top) and B16F1 (bottom) cells transfected with CAP1 siRNA oligonucleotides were stained with anti-CAP1 (left) and anti-cofilin-1 (right) antibodies. In CAP1 knockdown cells (arrows), cofilin-1 no longer localized to dynamic actin-rich structures, but instead it accumulated to the dot-like structures in the cytoplasm. (B) NIH3T3 cells transfected with CAP1 siRNA were treated with Gdn-HCl to denature proteins and stained with an anti actin (AC-15) (left) and cofilin-1(right) antibodies. The abnormal cofilin aggregates in CAP1 knockdown cells contain also actin. (C) F-actin (left), cofilin-1 (middle), and CAP1 (right) were visualized in B16F1 cells transfected with cofilin-1–specific RNA oligonucleotide duplexes. Cofilin-1 knockdown cell (arrow) shows similar accumulation of actin stress-fibers as seen in CAP1 knockdown cells. However, cofilin-1 depletion does not significantly affect the subcellular localization of CAP1. Bar, 10 μm.
Similar articles
- Actin-depolymerizing factor and cofilin-1 play overlapping roles in promoting rapid F-actin depolymerization in mammalian nonmuscle cells.
Hotulainen P, Paunola E, Vartiainen MK, Lappalainen P. Hotulainen P, et al. Mol Biol Cell. 2005 Feb;16(2):649-64. doi: 10.1091/mbc.e04-07-0555. Epub 2004 Nov 17. Mol Biol Cell. 2005. PMID: 15548599 Free PMC article. - Dynamic Phosphorylation and Dephosphorylation of Cyclase-Associated Protein 1 by Antagonistic Signaling through Cyclin-Dependent Kinase 5 and cAMP Are Critical for the Protein Functions in Actin Filament Disassembly and Cell Adhesion.
Zhang H, Ramsey A, Xiao Y, Karki U, Xie JY, Xu J, Kelly T, Ono S, Zhou GL. Zhang H, et al. Mol Cell Biol. 2020 Jan 30;40(4):e00282-19. doi: 10.1128/MCB.00282-19. Print 2020 Jan 30. Mol Cell Biol. 2020. PMID: 31791978 Free PMC article. - Mammalian adenylyl cyclase-associated protein 1 (CAP1) regulates cofilin function, the actin cytoskeleton, and cell adhesion.
Zhang H, Ghai P, Wu H, Wang C, Field J, Zhou GL. Zhang H, et al. J Biol Chem. 2013 Jul 19;288(29):20966-20977. doi: 10.1074/jbc.M113.484535. Epub 2013 Jun 4. J Biol Chem. 2013. PMID: 23737525 Free PMC article. - Accelerating on a treadmill: ADF/cofilin promotes rapid actin filament turnover in the dynamic cytoskeleton.
Theriot JA. Theriot JA. J Cell Biol. 1997 Mar 24;136(6):1165-8. doi: 10.1083/jcb.136.6.1165. J Cell Biol. 1997. PMID: 9087434 Free PMC article. Review. No abstract available. - The role of cyclase-associated protein in regulating actin filament dynamics - more than a monomer-sequestration factor.
Ono S. Ono S. J Cell Sci. 2013 Aug 1;126(Pt 15):3249-58. doi: 10.1242/jcs.128231. J Cell Sci. 2013. PMID: 23908377 Free PMC article. Review.
Cited by
- Actin-depolymerizing factor and cofilin-1 play overlapping roles in promoting rapid F-actin depolymerization in mammalian nonmuscle cells.
Hotulainen P, Paunola E, Vartiainen MK, Lappalainen P. Hotulainen P, et al. Mol Biol Cell. 2005 Feb;16(2):649-64. doi: 10.1091/mbc.e04-07-0555. Epub 2004 Nov 17. Mol Biol Cell. 2005. PMID: 15548599 Free PMC article. - Structural basis of rapid actin dynamics in the evolutionarily divergent Leishmania parasite.
Kotila T, Wioland H, Selvaraj M, Kogan K, Antenucci L, Jégou A, Huiskonen JT, Romet-Lemonne G, Lappalainen P. Kotila T, et al. Nat Commun. 2022 Jun 15;13(1):3442. doi: 10.1038/s41467-022-31068-y. Nat Commun. 2022. PMID: 35705539 Free PMC article. - CAP2 deficiency delays myofibril actin cytoskeleton differentiation and disturbs skeletal muscle architecture and function.
Kepser LJ, Damar F, De Cicco T, Chaponnier C, Prószyński TJ, Pagenstecher A, Rust MB. Kepser LJ, et al. Proc Natl Acad Sci U S A. 2019 Apr 23;116(17):8397-8402. doi: 10.1073/pnas.1813351116. Epub 2019 Apr 8. Proc Natl Acad Sci U S A. 2019. PMID: 30962377 Free PMC article. - The expression of CAP1 after traumatic brain injury and its role in astrocyte proliferation.
Zhang H, Liu Y, Li Y, Zhou Y, Chen D, Shen J, Yan Y, Yan S, Wu X, Li A, Guo A, Cheng C. Zhang H, et al. J Mol Neurosci. 2014 Dec;54(4):653-63. doi: 10.1007/s12031-014-0363-y. Epub 2014 Jul 25. J Mol Neurosci. 2014. PMID: 25060335
References
- Arber, S., Barbayannis, F.A., Hanser, H., Schneider, C., Stanyon, C.A., Bernard, O., and Caroni, P. (1998). Regulation of actin dynamics through phosphorylation of cofilin by LIM-kinase. Nature 393, 805–809. - PubMed
- Ayscough, K.R., Stryker, J., Pokala, N., Sanders, M., Crews, P., and Drubin, D.G. (1997). High rates of actin filament turnover in budding yeast and roles for actin in establishment and maintenance of cell polarity revealed using the actin inhibitor latrunculin-A. J. Cell Biol. 137, 399–416. - PMC - PubMed
- Balcer, H.I., Goodman, A.L., Rodal, A.A., Smith, E., Kugler, J., Heuser, J.E., and Goode, B.L. (2003). Coordinated regulation of actin filament turnover by a high molecular weight Srv2/CAP complex, cofilin, profilin, and Aip1. Curr. Biol. 13, 2159–2169. - PubMed
- Ballestrem, C., Wehrle-Haller, B., and Imhof, B.A. (1998). Actin dynamics in living mammalian cells. J. Cell Sci. 111, 1649–1658. - PubMed
- Baum, B., Li, W., and Perrimon, N. (2000). A cyclase-associated protein regulates actin and cell polarity during Drosophila oogenesis and in yeast. Curr. Biol. 10, 964–973. - PubMed
Publication types
MeSH terms
Substances
LinkOut - more resources
Full Text Sources
Other Literature Sources
Molecular Biology Databases
Research Materials
Miscellaneous
