Quantitative differences in lipid raft components between murine CD4+ and CD8+ T cells - PubMed (original) (raw)
Comparative Study
Quantitative differences in lipid raft components between murine CD4+ and CD8+ T cells
Valeria de Mello Coelho et al. BMC Immunol. 2004.
Abstract
Background: Lipid rafts have been shown to play a role in T cell maturation, activation as well as in the formation of immunological synapses in CD4+ helper and CD8+ cytotoxic T cells. However, the differential expression of lipid raft components between CD4+ and CD8+ T cells is still poorly defined. To examine this question, we analyzed the expression of GM1 in T cells from young and aged mice as well as the expression of the glycosylphosphatidylinositol (GPI)-linked protein Thy-1 and cholesterol in murine CD4+ and CD8+ T cell subpopulations.
Results: We found that CD4+CD8- and CD8+CD4- thymocytes at different stages of maturation display distinct GM1 surface expression. This phenomenon did not change with progressive aging, as these findings were consistent over the lifespan of the mouse. In the periphery, CD8+ T cells express significantly higher levels of GM1 than CD4+ T cells. In addition, we observed that GM1 levels increase over aging on CD8+ T cells but not in CD4+ T cells. We also verified that naïve (CD44lo) and memory (CD44hi) CD8+ T cells as well as naïve and memory CD4+ T cells express similar levels of GM1 on their surface. Furthermore, we found that CD8+ T cells express higher levels of the GPI-anchored cell surface protein Thy-1 associated with lipid raft domains as compared to CD4+ T cells. Finally, we observed higher levels of total cellular cholesterol in CD8+ T cells than CD4+ T cells.
Conclusion: These results demonstrate heterogeneity of lipid raft components between CD4+ and CD8+ T cells in young and aged mice. Such differences in lipid raft composition may contribute to the differential CD4 and CD8 molecule signaling pathways as well as possibly to the effector responses mediated by these T cell subsets following TCR activation.
Figures
Figure 1
GM1 expression on murine thymocyte subsets. Total thymocytes were isolated and analyzed by flow cytometric analysis after staining with CTB-FITC, anti-CD4 Percp and anti-CD8-PE antibodies. (A) Percentage of CD4+ and CD8+ thymocyte subsets expressing GM1. (B) The median fluorescence intensity (MFI) of GM1 expression by distinct CD4 and CD8 expressing T cells (n = 5). A significant difference in the GM1 expression on the cell surface was observed between CD4+CD8+ and CD8+CD4- or CD4+CD8- T cells (p ≤ 0.05) and between CD8+CD4- and CD4+CD8- T cells (p ≤ 0.05).
Figure 2
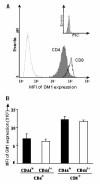
GM1 expression on splenic CD8+ is significantly higher than CD4+ T cells but not different between naïve and memory T cells. (A) Splenic T cells were isolated and submitted to flow cytometric analysis using anti-CD4 or CD8 antibodies and anti-rat Alexa-594 as secondary antibody in combination with CTB-FITC (Left peak represents cells unstained with CTB) (n = 5). Insert shows overlay of CD4 (grey) and CD8 (unfilled, right peak) forward scatter histograms indicating their size. Unstained cells were used as control (unfilled, left peak). (B) Purified CD4 and CD8 T cells were stained with anti-CD4-PerCp or anti-CD8-Cy5 in combination with CTB-FITC and CD44-Pe. CD4+ or CD8+ cells expressing CD44lo or CD44hi were gated and MFI of GM1 expression in the distinct subpopulations were analyzed. Black bars represent naïve cells and white bars, memory cells. Each experiments was performed utilizing two to three mice.
Figure 3
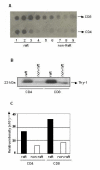
GM1 levels and Thy-1 GPI-anchored protein expression are higher in lipid raft domains from CD8+ than CD4+ T cells. (A) Splenic T cells from young mice were treated with Triton X-100 and lysates were submitted to ultracentrifugation on a sucrose gradient for lipid rafts isolation. Equal volumes of fractions were analyzed by dot blot analysis using CTB subunit conjugated to HRP. Raft and non-raft fractions are indicated. (B) Raft or non-raft fractions of CD4 and CD8 cell lines were pooled together and immunoprecipitated with mAb specific for Thy1 and subsequently detected using anti-thy1 antibody. (C) The relative density of thy1 bands seen in (B) for CD4+ and CD8+ cells were calculated using the Image Quant software (Amersham Biosciences) and shown in bar diagram. Black bars represent raft-pooled fractions and white bars, non-raft pooled fractions.
Figure 4
Splenic CD8+ T cells contain significantly higher levels of cholesterol than CD4+ T cells. Splenocytes were washed with PBS, lysed and cholesterol content was measured with a sensitive cholesterol oxidase-based fluorometric assay using the Amplex Red cholesterol kit (n = 3). A significant difference was observed between the CD4+CD8- and CD8+CD4- T cells (p ≤ 0.02).
Similar articles
- Human immunodeficiency virus type 1 uses lipid raft-colocalized CD4 and chemokine receptors for productive entry into CD4(+) T cells.
Popik W, Alce TM, Au WC. Popik W, et al. J Virol. 2002 May;76(10):4709-22. doi: 10.1128/jvi.76.10.4709-4722.2002. J Virol. 2002. PMID: 11967288 Free PMC article. - Differential role of lipid rafts in the functions of CD4+ and CD8+ human T lymphocytes with aging.
Larbi A, Dupuis G, Khalil A, Douziech N, Fortin C, Fülöp T Jr. Larbi A, et al. Cell Signal. 2006 Jul;18(7):1017-30. doi: 10.1016/j.cellsig.2005.08.016. Epub 2005 Oct 17. Cell Signal. 2006. PMID: 16236485 - Abnormal lipid rafts related ganglioside expression and signaling in T lymphocytes in immune thrombocytopenia patients.
Zhang X, Zhang D, Liu W, Li H, Fu R, Liu X, Xue F, Yang R. Zhang X, et al. Autoimmunity. 2016;49(1):58-68. doi: 10.3109/08916934.2015.1070837. Epub 2015 Aug 14. Autoimmunity. 2016. PMID: 26287565 - Heterogeneity of gangliosides among T cell subsets.
Inokuchi J, Nagafuku M, Ohno I, Suzuki A. Inokuchi J, et al. Cell Mol Life Sci. 2013 Sep;70(17):3067-75. doi: 10.1007/s00018-012-1208-x. Epub 2012 Dec 12. Cell Mol Life Sci. 2013. PMID: 23233133 Free PMC article. Review. - Gangliosides in T cell development and function of mice.
Inokuchi JI, Nagafuku M. Inokuchi JI, et al. Glycoconj J. 2022 Apr;39(2):229-238. doi: 10.1007/s10719-021-10037-5. Epub 2022 Feb 14. Glycoconj J. 2022. PMID: 35156158 Review.
Cited by
- Beta-glucosylceramide ameliorates liver inflammation in murine autoimmune cholangitis.
Zhang W, Moritoki Y, Tsuneyama K, Yang GX, Ilan Y, Lian ZX, Gershwin ME. Zhang W, et al. Clin Exp Immunol. 2009 Sep;157(3):359-64. doi: 10.1111/j.1365-2249.2009.03971.x. Clin Exp Immunol. 2009. PMID: 19664143 Free PMC article. - Flotillin-2 dampens T cell antigen sensitivity and functionality.
Moon S, Zhao F, Uddin MN, Tucker CJ, Karmaus PW, Fessler MB. Moon S, et al. JCI Insight. 2024 Dec 20;9(24):e182328. doi: 10.1172/jci.insight.182328. JCI Insight. 2024. PMID: 39499901 Free PMC article. - Exosomal 2',3'-CNP from mesenchymal stem cells promotes hippocampus CA1 neurogenesis/neuritogenesis and contributes to rescue of cognition/learning deficiencies of damaged brain.
Chen SY, Lin MC, Tsai JS, He PL, Luo WT, Chiu IM, Herschman HR, Li HJ. Chen SY, et al. Stem Cells Transl Med. 2020 Apr;9(4):499-517. doi: 10.1002/sctm.19-0174. Epub 2020 Jan 15. Stem Cells Transl Med. 2020. PMID: 31943851 Free PMC article. - CD4 and CD8 T cells require different membrane gangliosides for activation.
Nagafuku M, Okuyama K, Onimaru Y, Suzuki A, Odagiri Y, Yamashita T, Iwasaki K, Fujiwara M, Takayanagi M, Ohno I, Inokuchi J. Nagafuku M, et al. Proc Natl Acad Sci U S A. 2012 Feb 7;109(6):E336-42. doi: 10.1073/pnas.1114965109. Epub 2012 Jan 17. Proc Natl Acad Sci U S A. 2012. PMID: 22308377 Free PMC article. - Cutting edge: murine CD59a modulates antiviral CD4+ T cell activity in a complement-independent manner.
Longhi MP, Sivasankar B, Omidvar N, Morgan BP, Gallimore A. Longhi MP, et al. J Immunol. 2005 Dec 1;175(11):7098-102. doi: 10.4049/jimmunol.175.11.7098. J Immunol. 2005. PMID: 16301611 Free PMC article.
References
- Alonso MA, Millan J. The role of lipid rafts in signalling and membrane trafficking in T lymphocytes. J Cell Sci. 2001;114:3957–65. - PubMed
Publication types
MeSH terms
Substances
LinkOut - more resources
Full Text Sources
Research Materials
Miscellaneous


