From silencing to gene expression: real-time analysis in single cells - PubMed (original) (raw)
From silencing to gene expression: real-time analysis in single cells
Susan M Janicki et al. Cell. 2004.
Abstract
We have developed an inducible system to visualize gene expression at the levels of DNA, RNA and protein in living cells. The system is composed of a 200 copy transgene array integrated into a euchromatic region of chromosome 1 in human U2OS cells. The condensed array is heterochromatic as it is associated with HP1, histone H3 methylated at lysine 9, and several histone methyltransferases. Upon transcriptional induction, HP1alpha is depleted from the locus and the histone variant H3.3 is deposited suggesting that histone exchange is a mechanism through which heterochromatin is transformed into a transcriptionally active state. RNA levels at the transcription site increase immediately after the induction of transcription and the rate of synthesis slows over time. Using this system, we are able to correlate changes in chromatin structure with the progression of transcriptional activation allowing us to obtain a real-time integrative view of gene expression.
Figures
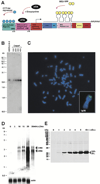
Figure 1. Characterization of Human U2OS 2-6-3 Cells
(A) Schematic representation of the gene expression plasmid, p3216PECMS2β. The plasmid is composed of 256 copies of the lac operator, 96 tetracycline response elements, a minimal CMV promoter, CFP fused to the peroxisomal targeting signal SKL, 24 MS2 translational operators (MS2 repeats), a rabbit β-globin intron/exon module, and a cleavage/polyadenylation signal. Expression of CFP-lac repressor allows the DNA to be visualized and expression of pTet-On (rtTA) in the presence of doxycycline (dox) drives expression from the CMV minimal promoter. When MS2-YFP (YFP fused to the MS2 coat protein) dimerizes and interacts with the stem loop structure of the translational operator, it allows the transcribed RNA to be visualized. (B) Quantitative Southern blot of clone 2-6-3 genomic DNA. A 2.4 kb fragment is produced when clone 2-6-3 genomic DNA and p3216PECMS2β are digested with NcoI which cuts at the 5′ end of CFP and within the β-globin intron. Comparison of known quantities of plasmid DNA equal to 100, 200, 300, and 400 copies per cell showed that 2-6-3 cells contain ~200 stably integrated copies of p3216PECMS2β. (C) DNA fluorescence in situ hybridization (DNA FISH) of 2-6-3 cells shows that there is a single integration site in the euchromatic region of chromosome 1p36. (D) Northern blot time course analysis of RNA isolated 0, 5, 10, 15, and 30 min after the induction of transcription. The last lane shows a lighter exposure of the 30 min time point. Pre-mRNA transcripts run at 3.4 kb and spliced mRNA at 2.8 kb. The probe recognizes the MS2 repeats. Actin was probed as a loading control. (E) Immunoblot time course analysis of CFP-SKL expression 0, 1, 2, 3, 4, 5, and 6 hr after the addition of doxycycline.
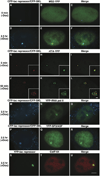
Figure 2. Visualization of DNA, RNA, and Protein in Living Cells
(A–F) U2OS 2-6-3 cells were transiently transfected with pSV2-CFP-lac repressor, pTet-ON (rtTA) and MS2-YFP, and imaging was begun 2.5 hr posttransfection. (A–C) At 0 min (−) dox, CFP-lac repressor marks the locus (A) and MS2-YFP is diffusely distributed throughout the nucleus (B). (D–F) 2.5 hr after the addition of Dox, the locus is highly decondensed and CFP-SKL is seen in the cytoplasmic peroxisomes (D). MS2-YFP accumulates at the site of the decondensed locus and is present in a particulate pattern throughout the nucleoplasm (E). (G–L) Image stacks of cells expressing pSV2-CFP-lac repressor (pseudocolored red) and EYFP-rtTA-N1 (pseudocolored green) were collected and deconvolved in cells fixed 5 min (G–I) and 60 min (J–L) after the induction of transcription. Single sections from deconvolved stacks are shown. (M–U) Factors involved in gene expression colocalize with the decondensed locus. YFP-RNA polymerase II (M–O), YFP-SF2/ASF (P–R), and Cstf64 (S–U) are present at the active locus. Scale bar is equal to 5 µm. Scale bar in enlarged insets is equal to 1 µm.
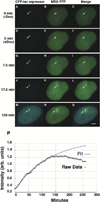
Figure 3. Kinetics of RNA Synthesis
(A–O) Still images from a time series of U2OS 2-6-3 cells during transcriptional activation showing the relationship between the chromatin of the locus, marked by CFP-lac repressor, and the RNA, marked by MS2-YFP. Also see Supplemental Data and Supplemental Movie S1 available on Cell website. Scale bar is equal to 5 µm. (P) Quantitative analysis and modeling of RNA levels at the locus. The intensity of the MS2-YFP signal at the locus as it associates with the synthesized RNA was measured every 2.5 min. There is an initial linear increase after the induction of transcription which slows over time (following the form A*(1−exp(−B*t))). The fit shows a deviation from this increase at 140 min after which a decrease predominates. There is a delay in the increase at 50 min.
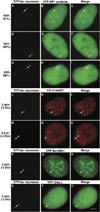
Figure 4. Characterization of the Condensed Heterochromatic Locus
YFP-HP1α (A–C), YFP-HP1β (D–F), and YFP-HP1γ (G–I) colocalize with the condensed locus, marked by CFP-lac repressor and the histone H3 is trimethylated on lysine 9 (H3 tri-meK9) (J–L). The H3 lysine 9 modification is not detected after the induction of transcription (M–O; 2.5 hr postdox). The histone H3 K9 methyltransferases YFP-Suv39h1 (P–R) and YFP-G9a-L (S–U) are present at the condensed locus. Scale bar is equal to 5 µm.
Figure 5. Chromatin Immunoprecipitation (ChIP) Analysis of Heterochromatin Proteins and Modifications on the Inactive Gene Expression Plasmid
Diagram (A) depicts the gene expression plasmid and the location of the primer pairs used: (a) promoter, (b) beginning of β-globin intron/exon module, (c) end of β-globin intron/exon module, (d) and (e) bacterial plasmid sequence. (B) Results of the ChIP analysis showing the localization of HP1α, HP1γ, histone H3 di- and tri-MeK9, and Eu-HMTase1 on the gene expression plasmid. (C) The levels of the associated factors and modifications are plotted.
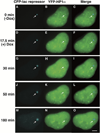
Figure 6. Dynamics of YFP-HP1α Depletion from the Locus during Transcriptional Activation
YFP-HP1α colocalizes with the condensed locus (0 min, A–C) and the condensed regions during the early time points of transcriptional activation (D–F, 17.5 min). It is seen in punctate structures at the 30 min time point (G–I) and appears smooth and diffuse by 50 min (J–L). 180 min postinduction, a dark region (HP1α depleted) that colocalizes with the decondensed locus, is seen in the YFP-HP1α image. Also see Supplemental Data and Supplemental Movie S2 available on Cell website. Scale bar is equal to 5 µm.
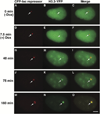
Figure 7. Analysis of the Deposition of the Histone Variant, H3.3, at the Locus during Transcriptional Activation
H3.3-YFP is not enriched at the condensed locus (A–C). A small spot adjacent to the locus is seen immediately after induction (D–F; 7.5 min). Significant deposition begins around the periphery of the decondensing locus (G–I, 40 min; J–L, 75 min) and eventually H3.3-YFP appears in a concentrated region that does not completely colocalize with CFP-lac repressor (pseudocolored red) (M–O; 180 min). Also see Supplemental Data and Supplemental Movie S3 available on Cell website. Scale bar is equal to 5 µm.
Comment in
- Visualizing gene expression: an unfolding story.
Henikoff S. Henikoff S. Cell. 2004 Mar 5;116(5):633-4. doi: 10.1016/s0092-8674(04)00209-0. Cell. 2004. PMID: 15006344
Similar articles
- Visualizing gene expression: an unfolding story.
Henikoff S. Henikoff S. Cell. 2004 Mar 5;116(5):633-4. doi: 10.1016/s0092-8674(04)00209-0. Cell. 2004. PMID: 15006344 - Mechanisms of HP1-mediated gene silencing in Drosophila.
Danzer JR, Wallrath LL. Danzer JR, et al. Development. 2004 Aug;131(15):3571-80. doi: 10.1242/dev.01223. Epub 2004 Jun 23. Development. 2004. PMID: 15215206 - In vivo HP1 targeting causes large-scale chromatin condensation and enhanced histone lysine methylation.
Verschure PJ, van der Kraan I, de Leeuw W, van der Vlag J, Carpenter AE, Belmont AS, van Driel R. Verschure PJ, et al. Mol Cell Biol. 2005 Jun;25(11):4552-64. doi: 10.1128/MCB.25.11.4552-4564.2005. Mol Cell Biol. 2005. PMID: 15899859 Free PMC article. - Connections between epigenetic gene silencing and human disease.
Moss TJ, Wallrath LL. Moss TJ, et al. Mutat Res. 2007 May 1;618(1-2):163-74. doi: 10.1016/j.mrfmmm.2006.05.038. Epub 2007 Jan 21. Mutat Res. 2007. PMID: 17306846 Free PMC article. Review. - Gene activation and gene silencing: a subtle equilibrium.
Quivy V, Calomme C, Dekoninck A, Demonte D, Bex F, Lamsoul I, Vanhulle C, Burny A, Van Lint C. Quivy V, et al. Cloning Stem Cells. 2004;6(2):140-9. doi: 10.1089/1536230041372454. Cloning Stem Cells. 2004. PMID: 15268788 Review.
Cited by
- The Xist RNA-PRC2 complex at 20-nm resolution reveals a low Xist stoichiometry and suggests a hit-and-run mechanism in mouse cells.
Sunwoo H, Wu JY, Lee JT. Sunwoo H, et al. Proc Natl Acad Sci U S A. 2015 Aug 4;112(31):E4216-25. doi: 10.1073/pnas.1503690112. Epub 2015 Jul 20. Proc Natl Acad Sci U S A. 2015. PMID: 26195790 Free PMC article. - Human RNA Polymerase II Segregates from Genes and Nascent RNA and Transcribes in the Presence of DNA-Bound dCas9.
Pessoa J, Carvalho C. Pessoa J, et al. Int J Mol Sci. 2024 Aug 1;25(15):8411. doi: 10.3390/ijms25158411. Int J Mol Sci. 2024. PMID: 39125980 Free PMC article. - Filamentation and biofilm formation are regulated by the phase-separation capacity of network transcription factors in Candida albicans.
Ganser C, Staples MI, Dowell M, Frazer C, Dainis J, Sircaik S, Bennett RJ. Ganser C, et al. PLoS Pathog. 2023 Dec 13;19(12):e1011833. doi: 10.1371/journal.ppat.1011833. eCollection 2023 Dec. PLoS Pathog. 2023. PMID: 38091321 Free PMC article. - Stochastic mRNA synthesis in mammalian cells.
Raj A, Peskin CS, Tranchina D, Vargas DY, Tyagi S. Raj A, et al. PLoS Biol. 2006 Oct;4(10):e309. doi: 10.1371/journal.pbio.0040309. PLoS Biol. 2006. PMID: 17048983 Free PMC article. - A WD-repeat protein stabilizes ORC binding to chromatin.
Shen Z, Sathyan KM, Geng Y, Zheng R, Chakraborty A, Freeman B, Wang F, Prasanth KV, Prasanth SG. Shen Z, et al. Mol Cell. 2010 Oct 8;40(1):99-111. doi: 10.1016/j.molcel.2010.09.021. Mol Cell. 2010. PMID: 20932478 Free PMC article.
References
- Ahmad K, Henikoff S. The histone variant H3.3 marks active chromatin by replication-independent nucleosome assembly. Mol. Cell. 2002;9:1191–1200. - PubMed
- Archer TK, Lee HL, Cordingley MG, Mymryk JS, Fragoso G, Berard DS, Hager GL. Differential steroid hormone induction of transcription from the mouse mammary tumor virus promoter. Mol. Endocrinol. 1994;8:568–576. - PubMed
- Ayyanathan K, Lechner MS, Bell P, Maul GG, Schultz DC, Yamada Y, Tanaka K, Torigoe K, Rauscher FJ., 3rd Regulated recruitment of HP1 to a euchromatic gene induces mitotically heritable, epigenetic gene silencing: a mammalian cell culture model of gene variegation. Genes Dev. 2003;17:1855–1869. - PMC - PubMed
- Bannister AJ, Zegerman P, Partridge JF, Miska EA, Thomas JO, Allshire RC, Kouzarides T. Selective recognition of methylated lysine 9 on histone H3 by the HP1 chromo domain. Nature. 2001;410:120–124. - PubMed
- Bannister AJ, Schneider R, Kouzarides T. Histone methylation: dynamic or static? Cell. 2002;109:801–806. - PubMed
Publication types
MeSH terms
Substances
Grants and funding
- R01 EB002060/EB/NIBIB NIH HHS/United States
- R01 GM067728/GM/NIGMS NIH HHS/United States
- GM42694/GM/NIGMS NIH HHS/United States
- GM067728/GM/NIGMS NIH HHS/United States
- R01 GM042694/GM/NIGMS NIH HHS/United States
LinkOut - more resources
Full Text Sources
Other Literature Sources
Research Materials
