Different gene expression patterns in invasive lobular and ductal carcinomas of the breast - PubMed (original) (raw)
Different gene expression patterns in invasive lobular and ductal carcinomas of the breast
Hongjuan Zhao et al. Mol Biol Cell. 2004 Jun.
Abstract
Invasive ductal carcinoma (IDC) and invasive lobular carcinoma (ILC) are the two major histological types of breast cancer worldwide. Whereas IDC incidence has remained stable, ILC is the most rapidly increasing breast cancer phenotype in the United States and Western Europe. It is not clear whether IDC and ILC represent molecularly distinct entities and what genes might be involved in the development of these two phenotypes. We conducted comprehensive gene expression profiling studies to address these questions. Total RNA from 21 ILCs, 38 IDCs, two lymph node metastases, and three normal tissues were amplified and hybridized to approximately 42,000 clone cDNA microarrays. Data were analyzed using hierarchical clustering algorithms and statistical analyses that identify differentially expressed genes (significance analysis of microarrays) and minimal subsets of genes (prediction analysis for microarrays) that succinctly distinguish ILCs and IDCs. Eleven of 21 (52%) of the ILCs ("typical" ILCs) clustered together and displayed different gene expression profiles from IDCs, whereas the other ILCs ("ductal-like" ILCs) were distributed between different IDC subtypes. Many of the differentially expressed genes between ILCs and IDCs code for proteins involved in cell adhesion/motility, lipid/fatty acid transport and metabolism, immune/defense response, and electron transport. Many genes that distinguish typical and ductal-like ILCs are involved in regulation of cell growth and immune response. Our data strongly suggest that over half the ILCs differ from IDCs not only in histological and clinical features but also in global transcription programs. The remaining ILCs closely resemble IDCs in their transcription patterns. Further studies are needed to explore the differences between ILC molecular subtypes and to determine whether they require different therapeutic strategies.
Figures
Figure 1.
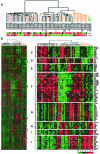
Unsupervised hierarchical clustering analysis of 64 breast samples. ULL represents the Norwegian samples and BC represents the Stanford samples. (A) Dendrogram representing similarities in the expression patterns between experimental samples. Thirty-eight IDCs are in black, 21 ILCs in orange, and three normal breast samples in green. Two lymph node metastases are marked with pink arrowheads. Three pairs of IDC and normal breast tissue from the same patient are marked with pairs of arrows of the same color. Samples were separated into four groups (group I–IV) by the clustering algorithm. The distributions of lymph node (LN) status and patient age at diagnosis are shown at the bottom. Red indicates positive or at least 55 years old, green is negative or <55 years of age, black is unknown, and gray is not applicable. (B) Overview of the gene expression patterns of 3314 genes whose expression varied more than threefold in at least three samples across the 64 breast samples. Each row represents a single gene, and each column an experimental sample. Colored bars identify the locations of the inserts in C–J. (C) Proliferation/cell cycle regulation cluster. (D) E-cadherin cluster. (E) ERBB2 cluster. (F) ER and its coexpressed gene cluster. (G) Stromal/fibroblast cell cluster. (H) Basal keratin cluster. (I) EGFR cluster. (J) Adipose-enriched cluster.
Figure 2.
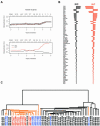
Identification of gene expression patterns distinguishing IDCs and ILCs by PAM. (A) Relationships of value of threshold in cross-validation, number of genes identified, and overall misclassification rate or misclassification rate for each tumor type are shown in the top and bottom graph, respectively. (B) Seventy-eight clones were selected at threshold of 2.9 that separated IDCs and ILCs with the lowest overall misclassification rate. Bars to the right of the middle line indicate relative overexpression, and bars to the left indicate relative underexpression. The length of the bar represents the relative degree of variation. (C) Hierarchical clustering analysis of the 59 samples by using the 78 clones identified by PAM. In the dendrogram, IDCs are black and ILCs are orange. Case names in red indicate typical ILCs, those in blue indicate ductal-like ILCs, and those in black indicate IDCs.
Figure 4.
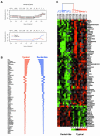
Identification of gene expression patterns that distinguish typical and ductal-like ILCs by using PAM. (A) Relationships of value of threshold in cross validation, number of genes identified and overall misclassification rate or misclassification rate for each tumor type were shown in the top and bottom graph, respectively. (B) Seventy-six clones were selected at threshold of 2.3 that separated typical and ductal-like ILCs with the lowest overall misclassification rate. Bars to the right of the middle line indicate relative overexpression, and bars to the left indicate relative underexpression. The length of the bar represents the relative degree of variation. (C) Hierarchical clustering analysis of the 21 ILC samples by using the 76 clones identified by PAM. Typical ILCs are in red in the dendrogram on top of the image and ductal-like ILCs are in blue.
Figure 3.
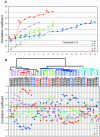
Comparison of gene expression patterns of ILCs and IDCs by using intrinsic genes. (A). The highest Pearson's correlation coefficients between each of the 59 primary tumors and five sets of centroids derived from 122 breast samples published previously were plotted in color corresponding to the subtype to which the samples were assigned. Open arrow heads indicate typical ILCs and filled arrowheads ductal-like ILCs. NR, nonrelated (r < 0.14); NL, normal-like; LA, luminal A; LB, luminal B; EB, ERBB2; and BL, basal-like subtype. (B) Top, dendrogram of hierarchical clustering analysis of the 59 primary tumors by using 481 intrinsic genes after spot quality selection. Fifty-six of 59 samples were categorized into one of the five subtypes of breast carcinomas identified previously based on their Pearson's r. The branches are colored as basal subtype in red, ERBB2 subtype in lavender, normal-like subtype in green, luminal A subtype in blue, and luminal B subtype in teal. Three samples colored in gray showed correlation below threshold. The sample labels are red for typical ILCs, blue for ductal-like ILCs, and black for IDCs. Bottom, Pearson's correlation coefficients between each of the 59 primary tumors and five sets of centroids derived from 122 breast samples published previously (49). Each vertical line corresponds to one sample label on top of the graph. NL, normal-like; LA, luminal A; LB, luminal B; EB, ERBB2; BL, basal-like subtype; and TR, threshold. (C) Overview of the gene expression patterns of 488 genes across the 59 breast samples. Each row represents a single gene, and each column an experimental sample. Colored bars identify the locations of the inserts in D–K. Orange bars under the dendrogram identify positions of ILCs. (D) ERBB2 cluster. (E) E-cadherin cluster. (F) MUC1 cluster. (G) Unknown cluster, expressed in a subset of tumors that overexpress ER and coexpressed genes. (H) ER and its coexpressed gene cluster (luminal epithelial cell cluster). (I) Basal epithelial cell cluster 1. (J) Basal epithelial cell cluster 2. (K) Unknown cluster, inversely correlated with ER and coexpressed genes.
Similar articles
- Lobular and ductal carcinomas of the breast have distinct genomic and expression profiles.
Bertucci F, Orsetti B, Nègre V, Finetti P, Rougé C, Ahomadegbe JC, Bibeau F, Mathieu MC, Treilleux I, Jacquemier J, Ursule L, Martinec A, Wang Q, Bénard J, Puisieux A, Birnbaum D, Theillet C. Bertucci F, et al. Oncogene. 2008 Sep 11;27(40):5359-72. doi: 10.1038/onc.2008.158. Epub 2008 May 19. Oncogene. 2008. PMID: 18490921 Free PMC article. - Novel markers for differentiation of lobular and ductal invasive breast carcinomas by laser microdissection and microarray analysis.
Turashvili G, Bouchal J, Baumforth K, Wei W, Dziechciarkova M, Ehrmann J, Klein J, Fridman E, Skarda J, Srovnal J, Hajduch M, Murray P, Kolar Z. Turashvili G, et al. BMC Cancer. 2007 Mar 27;7:55. doi: 10.1186/1471-2407-7-55. BMC Cancer. 2007. PMID: 17389037 Free PMC article. - Comprehensive Review of Molecular Mechanisms and Clinical Features of Invasive Lobular Cancer.
Pramod N, Nigam A, Basree M, Mawalkar R, Mehra S, Shinde N, Tozbikian G, Williams N, Majumder S, Ramaswamy B. Pramod N, et al. Oncologist. 2021 Jun;26(6):e943-e953. doi: 10.1002/onco.13734. Epub 2021 Mar 16. Oncologist. 2021. PMID: 33641217 Free PMC article. Review. - Differentiation of tumours of ductal and lobular origin: II. Genomics of invasive ductal and lobular breast carcinomas.
Turashvili G, Bouchal J, Burkadze G, Kolár Z. Turashvili G, et al. Biomed Pap Med Fac Univ Palacky Olomouc Czech Repub. 2005 Jun;149(1):63-8. doi: 10.5507/bp.2005.006. Biomed Pap Med Fac Univ Palacky Olomouc Czech Repub. 2005. PMID: 16170390 Review.
Cited by
- Transcriptomic analysis identifies enrichment of cAMP/PKA/CREB signaling in invasive lobular breast cancer.
Puthanmadhom Narayanan S, Wedn AM, Shah OS, Chen J, Brown DD, McAuliffe PF, Oesterreich S, Lee AV. Puthanmadhom Narayanan S, et al. Breast Cancer Res. 2024 Oct 30;26(1):149. doi: 10.1186/s13058-024-01900-y. Breast Cancer Res. 2024. PMID: 39478577 Free PMC article. - Evaluation of circulating plasma proteins in prostate cancer using mendelian randomization.
Cheng L, Qiu Z, Wu X, Dong Z. Cheng L, et al. Discov Oncol. 2024 Sep 17;15(1):453. doi: 10.1007/s12672-024-01331-3. Discov Oncol. 2024. PMID: 39287922 Free PMC article. - Are Meteorin-Like Peptide and Asprosin Important in the Diagnosis of Breast Tumors?
Kocaman N, Onat E, Balta H, Üçer Ö. Kocaman N, et al. Cureus. 2024 Jun 23;16(6):e62979. doi: 10.7759/cureus.62979. eCollection 2024 Jun. Cureus. 2024. PMID: 39044875 Free PMC article. - Identification of microRNA biomarkers simultaneously expressed in circulating extracellular vesicles and atherosclerotic plaques.
Brandes F, Meidert AS, Kirchner B, Yu M, Gebhardt S, Steinlein OK, Dolch ME, Rantner B, Tsilimparis N, Schelling G, Pfaffl MW, Reithmair M. Brandes F, et al. Front Cardiovasc Med. 2024 Apr 25;11:1307832. doi: 10.3389/fcvm.2024.1307832. eCollection 2024. Front Cardiovasc Med. 2024. PMID: 38725837 Free PMC article. - Long noncoding RNA DLEU2 and ROR1 pathway induces epithelial-to-mesenchymal transition and cancer stem cells in breast cancer.
Islam SS, Al-Tweigeri T, Al-Harbi L, Ujjahan S, Al-Mozaini M, Tulbah A, Aboussekhra A. Islam SS, et al. Cell Death Discov. 2024 Jan 31;10(1):61. doi: 10.1038/s41420-024-01829-3. Cell Death Discov. 2024. PMID: 38296962 Free PMC article.
References
- Agarwal, V.R., Bischoff, E.D., Hermann, T., and Lamph, W.W. (2000). Induction of adipocyte specific gene expression is correlated with mammary tumor regression by the retinoid X receptor-ligand LGD1069 (targretin). Cancer Res. 60, 6033-6038. - PubMed
- Ahr, A., Holtrich, U., Solbach, C., Scharl, A., Strebhardt, K., Karn, T., and Kaufmann, M. (2001). Molecular classification of breast cancer patients by gene expression profiling. J. Pathol. 195, 312-320. - PubMed
- Ahr, A., Karn, T., Solbach, C., Seiter, T., Strebhardt, K., Holtrich, U., and Kaufmann, M. (2002). Identification of high risk breast-cancer patients by gene expression profiling. Lancet 359, 131-132. - PubMed
- Bartsch, H., Nair, J., and Owen, R.W. (1999). Dietary polyunsaturated fatty acids and cancers of the breast and colorectum: emerging evidence for their role as risk modifiers. Carcinogenesis 20, 2209-2218. - PubMed
Publication types
MeSH terms
Substances
LinkOut - more resources
Full Text Sources
Other Literature Sources
Medical


