Murine cystathionine gamma-lyase: complete cDNA and genomic sequences, promoter activity, tissue distribution and developmental expression - PubMed (original) (raw)
Murine cystathionine gamma-lyase: complete cDNA and genomic sequences, promoter activity, tissue distribution and developmental expression
Isao Ishii et al. Biochem J. 2004.
Abstract
Cystathionine gamma-lyase (CSE) is the last key enzyme in the trans-sulphuration pathway for biosynthesis of cysteine from methionine. Cysteine could be provided through diet; however, CSE has been shown to be important for the adequate supply of cysteine to synthesize glutathione, a major intracellular antioxidant. With a view to determining physiological roles of CSE in mice, we report the sequence of a complete mouse CSE cDNA along with its associated genomic structure, generation of specific polyclonal antibodies, and the tissue distribution and developmental expression patterns of CSE in mice. A 1.8 kb full-length cDNA containing an open reading frame of 1197 bp, which encodes a 43.6 kDa protein, was isolated from adult mouse kidney. A 35 kb mouse genomic fragment was obtained by lambda genomic library screening. It contained promoter regions, 12 exons, ranging in size from 53 to 579 bp, spanning over 30 kb, and exon/intron boundaries that were conserved with rat and human CSE. The GC-rich core promoter contained canonical TATA and CAAT motifs, and several transcription factor-binding consensus sequences. The CSE transcript, protein and enzymic activity were detected in liver, kidney, and, at much lower levels, in small intestine and stomach of both rats and mice. In developing mouse liver and kidney, the expression levels of CSE protein and activity gradually increased with age until reaching their peak value at 3 weeks of age, following which the expression levels in liver remained constant, whereas those in kidney decreased significantly. Immunohistochemical analyses revealed predominant CSE expression in hepatocytes and kidney cortical tubuli. These results suggest important physiological roles for CSE in mice.
Figures
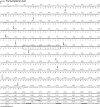
Figure 1. Full-length cDNA and predicted amino acid sequences of the mouse kidney CSE
The transcriptional start site shown by a broken arrow is set at 1. The 1815 bp sequence contains a 1197 bp ORF that extends over bases 34–1230 (*, a stop codon). All the 11 exon/intron boundaries are indicated by arrows. A putative PLP-binding site and poly(A)+ consensus signal sequences (ATTAAA or AATAAA) are boxed and underlined respectively.
Figure 2. Sequence identity of CSE
Table of percentage ORF nucleotide identity (in the upper right half) or percentage amino acid identity (in the lower left half) of CSE sequences from mouse, rat, human, C. elegans (2H346 and 5Q581) and Saccharomyces cerevisiae (GenBank® accession numbers AY083352, AB052882, NM_001902, NM_063048, NM_074652 and D14135 respectively). The number of amino acids (aa) in ORFs and estimated molecular masses (kDa) are shown.
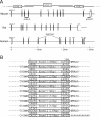
Figure 3. Structure of the mouse CSE gene
(A) Schematic representation of mammalian (mouse, rat and human) CSE genes. Organization of mouse CSE gene was revealed by sequencing three overlapping λ phage clones (λCSE-1–3) that were isolated by screening the mouse genomic library with probes A and B. Sequences of rat and human CSE genes were obtained from the NCBI database. All three mammalian CSE genes consist of 12 exons with conserved exon/intron boundaries. A splice variant that skips exon 5 was reported in human liver. (B) Exon/intron boundaries in the mouse CSE gene. Exons (53–579 bp) are boxed with nucleotide numbers above when the transcriptional start site is set at 1. Invariant AG/GT sequences (splicing consensuses) are shown in bold.
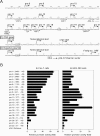
Figure 4. Promoter activity of the mouse CSE gene
(A) Nucleotide sequence of the 5′-flanking region of the mouse CSE gene. Numbering is relative to the transcriptional start site. Transcriptional start sites, translational start sites in the CSE gene (1) and the reporter plasmid (2), and the 5′-ends of the deletion constructs, are all shown by broken arrows. Putative transcriptional-factor-binding sites are indicated by arrows below the sequences. The consensus TATAA and CAAT motifs are boxed. (B) Defining core regions of the mouse CSE promoter by deletion analyses. Serial deletion constructs were inserted upstream of the firefly luciferase gene in the pGL3-Enhancer reporter plasmid. Each deletion construct was transiently transfected into Cos-7 cells (left panel) or HEK-293 cells (right panel), together with larger amounts of pRL-TK plasmid containing the Renilla luciferase gene. Both (firefly and Renilla) luciferase activities were measured 2 days later, and the promoter activity was expressed as multiples of induction relative to the activity (the ratio between firefly and Renilla luciferase activities) when promoterless pGL3-Enhancer plasmid was transfected. Results shown are means±S.E.M. for 16 samples from four experiments.
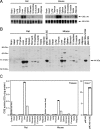
Figure 5. Tissue distribution of the CSE transcript, protein and enzymic activity in rat and mouse
(A) Distribution of the CSE transcript. Total RNA isolated from each tissue of an adult male rat or mouse (both 8 weeks old) was analysed by Northern blot (10 μg/lane), and approx. 2 kb single bands were detected. As a loading control, 18 S rRNA was stained with ethidium bromide. (B) Distribution of the CSE protein. Tissue extracts (5 μg/lane) or Cos-7 cell extracts (2 μg/lane) were fractioned on SDS/PAGE (10% gel). The 44 kDa proteins specific to CSE were detected by Western-blot analyses. (C) Distribution of CSE enzyme activity in tissue extracts. Boiled liver samples were loaded as negative controls or reaction backgrounds. Results shown are means±S.E.M. for triplicate samples from a representative experiment. Cell extracts were prepared from Cos-7 cells transfected with CSE expression vectors and used as positive controls in both Western-blot analyses (B) and enzyme assay (C). OD727=_A_727.
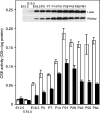
Figure 6. Developmental expression of the CSE protein and enzyme activity in mouse liver (□) and kidney (▪)
Cell extracts prepared from both tissues at various developmental stages (E12.5–P84) were analysed for CSE protein expression by Western blotting (inset) and CSE enzyme activity (histogram). Bars shown represent means±S.E.M. for samples from three to four mice. For E12.5 liver and kidney, samples from three to four embryos were pooled because of their small yields. OD727=_A_727.
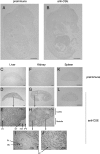
Figure 7. Expression of the CSE protein in E15.5 embryos and adult mouse tissues: liver, kidney and spleen
Midsagittal sections of E15.5 embryos (A, B), 8-week-old male liver (C–E), kidney (F–J) and spleen (K, L). Sections were stained with anti-CSE N-terminal antibody (B, D, E, G–J, L) or with pre-immune serum as negative controls (A, C, F, K). BC, Bowman's capsule; CV, central vein; GL, glomerulus; IHA, interlobular hepatic artery; ICT, interlobular connective tissue; IPV, interlobular portal vein; RT, renal tubules. Scale bars, 1 mm (and 0.1 mm in E, H, I and J).
Similar articles
- Cloning and characterization of the full-length cDNA and genomic sequences encoding murine acid ceramidase.
Li CM, Hong SB, Kopal G, He X, Linke T, Hou WS, Koch J, Gatt S, Sandhoff K, Schuchman EH. Li CM, et al. Genomics. 1998 Jun 1;50(2):267-74. doi: 10.1006/geno.1998.5334. Genomics. 1998. PMID: 9653654 - Molecular cloning and characterization of a human cDNA and gene encoding a novel acid ceramidase-like protein.
Hong SB, Li CM, Rhee HJ, Park JH, He X, Levy B, Yoo OJ, Schuchman EH. Hong SB, et al. Genomics. 1999 Dec 1;62(2):232-41. doi: 10.1006/geno.1999.5953. Genomics. 1999. PMID: 10610717 - The murine biglycan: complete cDNA cloning, genomic organization, promoter function, and expression.
Wegrowski Y, Pillarisetti J, Danielson KG, Suzuki S, Iozzo RV. Wegrowski Y, et al. Genomics. 1995 Nov 1;30(1):8-17. doi: 10.1006/geno.1995.0002. Genomics. 1995. PMID: 8595907 - Genomic organization and promoter analysis of the mouse ADP-ribosylarginine hydrolase gene.
Aoki K, Kato J, Shoemaker MT, Moss J. Aoki K, et al. Gene. 2005 May 23;351:83-95. doi: 10.1016/j.gene.2005.02.016. Gene. 2005. PMID: 15893437 - [A novel metabolic pathway of mercapturic acids--methylthiolation].
Tateishi M, Tomisawa H, Ichihara S. Tateishi M, et al. Tanpakushitsu Kakusan Koso. 1985 Feb;30(2):130-42. Tanpakushitsu Kakusan Koso. 1985. PMID: 3887491 Review. Japanese. No abstract available.
Cited by
- Hydrogen Sulfide (H2S)/Polysulfides (H2Sn) Signalling and TRPA1 Channels Modification on Sulfur Metabolism.
Kimura H. Kimura H. Biomolecules. 2024 Jan 19;14(1):129. doi: 10.3390/biom14010129. Biomolecules. 2024. PMID: 38275758 Free PMC article. Review. - Hydrogen sulfide signalling in neurodegenerative diseases.
Tripathi SJ, Chakraborty S, Miller E, Pieper AA, Paul BD. Tripathi SJ, et al. Br J Pharmacol. 2023 Jun 20:10.1111/bph.16170. doi: 10.1111/bph.16170. Online ahead of print. Br J Pharmacol. 2023. PMID: 37338307 Review. - Cystine rather than cysteine is the preferred substrate for β-elimination by cystathionine γ-lyase: implications for dietary methionine restriction.
Jeitner TM, Azcona JA, Ables GP, Cooke D, Horowitz MC, Singh P, Kelly JM, Cooper AJL. Jeitner TM, et al. Geroscience. 2024 Aug;46(4):3617-3634. doi: 10.1007/s11357-023-00788-4. Epub 2023 May 23. Geroscience. 2024. PMID: 37217633 Free PMC article. - Appraising the Role of Astrocytes as Suppliers of Neuronal Glutathione Precursors.
Pérez-Sala D, Pajares MA. Pérez-Sala D, et al. Int J Mol Sci. 2023 Apr 29;24(9):8059. doi: 10.3390/ijms24098059. Int J Mol Sci. 2023. PMID: 37175763 Free PMC article. Review. - Carotid body responses to O2 and CO2 in hypoxia-tolerant naked mole rats.
Peng YJ, Nanduri J, Wang N, Khan SA, Pamenter ME, Prabhakar NR. Peng YJ, et al. Acta Physiol (Oxf). 2022 Oct;236(2):e13851. doi: 10.1111/apha.13851. Epub 2022 Jun 27. Acta Physiol (Oxf). 2022. PMID: 35757963 Free PMC article.
References
- Yamanishi T., Tuboi S. The mechanism of the L-cystine cleavage reaction catalyzed by rat liver γ-cystathionase. J. Biochem. (Tokyo) 1981;89:1913–1921. - PubMed
- Hosoki R., Matsuki N., Kimura H. The possible role of hydrogen sulfide as an endogenous smooth muscle relaxant in synergy with nitric oxide. Biochem. Biophys. Res. Commun. 1997;237:527–531. - PubMed
Publication types
MeSH terms
Substances
LinkOut - more resources
Full Text Sources
Molecular Biology Databases
Miscellaneous
