Inhibition of platelet-derived growth factor promotes pericyte loss and angiogenesis in ischemic retinopathy - PubMed (original) (raw)
Comparative Study
Inhibition of platelet-derived growth factor promotes pericyte loss and angiogenesis in ischemic retinopathy
Jennifer L Wilkinson-Berka et al. Am J Pathol. 2004 Apr.
Abstract
We investigated whether inhibition of platelet-derived growth factor (PDGF) receptor tyrosine kinase activity would affect pericyte viability, vascular endothelial growth factor (VEGF)/vascular endothelial growth factor receptor-2 (VEGFR-2) expression and angiogenesis in a model of retinopathy of prematurity (ROP). ROP was induced in Sprague Dawley rats by exposure to 80% oxygen from postnatal (P) days 0 to 11 (with 3 hours/day in room air), and then room air from P12-18 (angiogenesis period). Shams were neonatal rats in room air from P0-18. STI571, a potent inhibitor of PDGF receptor tyrosine kinase, was administered from P12-18 at 50 or 100 mg/kg/day intraperitoneal (i.p.). Electron microscopy revealed that pericytes in the inner retina of both sham and ROP rats appeared normal; however STI571 induced a selective pericyte and vascular smooth muscle degeneration. Immunolabeling for caspase-3 and alpha-smooth muscle cell actin in consecutive paraffin sections of retinas confirmed that these degenerating cells were apoptotic pericytes. In all groups, VEGF and VEGFR-2 gene expression was located in ganglion cells, the inner nuclear layer, and retinal pigment epithelium. ROP was associated with an increase in both VEGF and VEGFR-2 gene expression and blood vessel profiles in the inner retina compared to sham rats. STI571 at both doses increased VEGF and VEGFR-2 mRNA and exacerbated angiogenesis in ROP rats, and in sham rats at 100 mg/kg/day. In conclusion, PDGF is required for pericyte viability and the subsequent prevention of VEGF/VEGFR-2 overexpression and angiogenesis in ROP.
Figures
Figure 1-4039
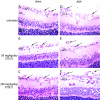
Three-μm paraffin sections of inner retina from 18-day-old Sprague Dawley rats following retinopathy of prematurity (ROP) and treatment with STI571. A: Untreated sham rats. B: Sham rats treated with 50 mg/kg/day STI571. C: Sham rats treated with 100 mg/kg/day STI571. D: Untreated ROP. E: ROP rats treated with 50 mg/kg/day STI571. F: ROP rats treated with 100 mg/kg/day STI571. Arrows denote blood vessels. GCL, ganglion cell layer; IPL, inner plexiform layer; INL, inner nuclear layer; ONL, outer nuclear layer. Original magnification, ×200.
Figure 2-4039
Quantitation of blood vessel profiles (BVPs) in the inner retina of 18-day-old Sprague Dawley rats with retinopathy of prematurity (ROP) and treated with STI571. Values are mean ± SEM. N = 6 to 8 rats per group. U, untreated. *, P < 0.001 compared to sham groups. #, P < 0.01 compared to untreated ROP.
Figure 3-4039
Transmission electron micrographs of blood vessels in the inner retina of 18-day-old rats with retinopathy of prematurity (ROP) and treated with STI571. A: Untreated sham showing a normal capillary with an open lumen (L). Original magnification, ×9000. B: Sham rat treated with 100 mg/kg/day STI571. Retinal capillary contains a pericyte with an electron-lucent appearance and vacuolated cytoplasm. Original magnification, ×5000. C: Untreated ROP showing a closed retinal capillary with apparently a normal pericyte and endothelial cell. Original magnification, ×9000. D: ROP rat treated with 100 mg/kg/day STI571. Disruption of vascular smooth muscle cells in retinal arterioles and venules as shown by necrotic and vacuolated cells, although endothelial cells appear normal in some instances. Original magnification, ×2500.
Figure 4-4039
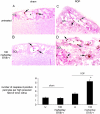
Three-μm paraffin sections of inner retina from 18-day-old Sprague Dawley rats immunolabeled with caspase-3. A: Untreated sham rats. B: Sham rats treated with 100 mg/kg/day STI571. C: Untreated ROP. D: ROP rats treated with 100 mg/kg/day STI571. Original magnification, ×400. N = 6 to 8 rats per group. Caspase-3-positive cells (arrows) were confirmed to be pericytes by examination of α-smooth muscle cell immunolabeling in consecutive sections (not shown). Caspase-3-positive cells are associated with blood vessels (asterisks) and most numerous in ROP rats treated with 100 mg/kg/day STI571 (D). Sections are counterstained with eosin. GCL, ganglion cell layer. Quantitation of apoptotic pericytes is shown graphically. Values are means ± SEM. N = 6 to 8 rats per group. U, untreated. *, P < 0.0001 compared to all groups. **, P < 0.001 compared to sham groups.
Figure 5-4039
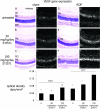
Paired bright and dark field photomicrographs showing vascular endothelial growth factor (VEGF) gene expression in 3-μm thick paraffin sections of retinas from sham and ROP rats treated with STI571. Sections are counterstained with hematoxylin and eosin. The paired bright and dark field panels on the left show sham groups and the paired bright and dark field panels on the right are ROP groups. GCL, ganglion cell layer; IPL, inner plexiform layer; INL, inner nuclear layer; ONL, outer nuclear layer; RPE, retinal pigment epithelium. Original magnification, ×120. In all groups, VEGF mRNA is observed in the GCL, IPL and INL and the RPE. Untreated sham (A and a) and sham + 50 mg/kg/day (B and b) are similar with mRNA most notable over the INL. Sham + 100 mg/kg/day STI571 (C and c) shows an increase in mRNA in the inner retina compared to sham groups. ROP (D and d), shows intense VEGF mRNA in the inner retina and particularly the INL. ROP + 50 mg/kg/day STI571 (E and e) shows increased signal in the inner retina compared to untreated ROP which is further increased in the ROP + 100 mg/kg/day STI571 group (F and f). Results are presented graphically. Values are means ± SEM. N = 6 to 8 rats per group. U, untreated. *, P < 0.0001 compared to all groups except sham + 50 mg/kg/day STI571. *, P < 0.0001 compared to all groups except untreated sham.  , P < 0.005 compared to ROP + 50 mg/kg/day STI571. †, P < 0.0001 compared to ROP groups. ‡, P < 0.0001 compared to all groups.
Figure 6-4039
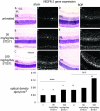
Paired bright and dark field photomicrographs showing vascular endothelial growth factor 2 (VEGFR-2) gene expression in 3-μm thick paraffin sections of retinas from sham and ROP rats treated with STI571. Sections are counterstained with hematoxylin and eosin. The paired bright and dark field panels on the left show sham groups and the paired bright and dark field panels on the right are ROP groups. GCL, ganglion cell layer; IPL, inner plexiform layer; INL, inner nuclear layer; ONL, outer nuclear layer; RPE, retinal pigment epithelium. Original magnification ×120. In all groups, VEGF mRNA is observed in the GCL, IPL and INL and the RPE. Untreated sham (A and a) and sham + 50 mg/kg/day (B and b) are similar with mRNA most notable over the INL. Sham + 100 mg/kg/day STI571 (C and c) shows an increase in mRNA in the inner retina compared to sham groups. ROP (D and d), shows intense VEGF mRNA in the inner retina and particularly the INL. ROP + 50 mg/kg/day STI571 (E and e) shows increased signal in the inner retina compared to untreated ROP which is further increased in the ROP + 100 mg/kg/day STI571 group (F and f). Results are shown graphically. Values are means ± SEM. N = 6 to 8 rats per group. *, P < 0.0001 compared to all groups except sham + 50 mg/kg/day STI571.  , P < 0.0001 compared to all groups except untreated sham. †, P < 0.0001 compared to sham groups and ROP + 100 mg/kg/day STI571. ‡, P < 0.05 compared to ROP + 50 mg/kg/day STI571. §, P < 0.001 compared to ROP + 100 mg/kg/day STI571. §§, P < 0.0001 compared to all groups.
Similar articles
- Expression of vascular endothelial growth factor and pigment epithelial-derived factor in a rat model of retinopathy of prematurity.
Hartmann JS, Thompson H, Wang H, Kanekar S, Huang W, Budd SJ, Hartnett ME. Hartmann JS, et al. Mol Vis. 2011;17:1577-87. Epub 2011 Jun 10. Mol Vis. 2011. PMID: 21738387 Free PMC article. - SB-267268, a nonpeptidic antagonist of alpha(v)beta3 and alpha(v)beta5 integrins, reduces angiogenesis and VEGF expression in a mouse model of retinopathy of prematurity.
Wilkinson-Berka JL, Jones D, Taylor G, Jaworski K, Kelly DJ, Ludbrook SB, Willette RN, Kumar S, Gilbert RE. Wilkinson-Berka JL, et al. Invest Ophthalmol Vis Sci. 2006 Apr;47(4):1600-5. doi: 10.1167/iovs.05-1314. Invest Ophthalmol Vis Sci. 2006. PMID: 16565398 - Short-term treatment with VEGF receptor inhibitors induces retinopathy of prematurity-like abnormal vascular growth in neonatal rats.
Nakano A, Nakahara T, Mori A, Ushikubo H, Sakamoto K, Ishii K. Nakano A, et al. Exp Eye Res. 2016 Feb;143:120-31. doi: 10.1016/j.exer.2015.10.016. Epub 2015 Oct 22. Exp Eye Res. 2016. PMID: 26500193
Cited by
- Retinal inflammation in murine models of type 1 and type 2 diabetes with diabetic retinopathy.
Dharmarajan S, Carrillo C, Qi Z, Wilson JM, Baucum AJ 2nd, Sorenson CM, Sheibani N, Belecky-Adams TL. Dharmarajan S, et al. Diabetologia. 2023 Nov;66(11):2170-2185. doi: 10.1007/s00125-023-05995-4. Epub 2023 Sep 5. Diabetologia. 2023. PMID: 37670018 Free PMC article. - Mural cell associated VEGF is required for organotypic vessel formation.
Evensen L, Micklem DR, Blois A, Berge SV, Aarsaether N, Littlewood-Evans A, Wood J, Lorens JB. Evensen L, et al. PLoS One. 2009 Jun 4;4(6):e5798. doi: 10.1371/journal.pone.0005798. PLoS One. 2009. PMID: 19495422 Free PMC article. - Hyperoxia inhibits several critical aspects of vascular development.
Uno K, Merges CA, Grebe R, Lutty GA, Prow TW. Uno K, et al. Dev Dyn. 2007 Apr;236(4):981-90. doi: 10.1002/dvdy.21122. Dev Dyn. 2007. PMID: 17366630 Free PMC article. - Systemic Cytokines in Retinopathy of Prematurity.
Wu PY, Fu YK, Lien RI, Chiang MC, Lee CC, Chen HC, Hsueh YJ, Chen KJ, Wang NK, Liu L, Chen YP, Hwang YS, Lai CC, Wu WC. Wu PY, et al. J Pers Med. 2023 Feb 5;13(2):291. doi: 10.3390/jpm13020291. J Pers Med. 2023. PMID: 36836525 Free PMC article. Review. - Calpain- and talin-dependent control of microvascular pericyte contractility and cellular stiffness.
Kotecki M, Zeiger AS, Van Vliet KJ, Herman IM. Kotecki M, et al. Microvasc Res. 2010 Dec;80(3):339-48. doi: 10.1016/j.mvr.2010.07.012. Epub 2010 Aug 12. Microvasc Res. 2010. PMID: 20709086 Free PMC article.
References
- Gardner TW, Antonetti DA, Barber AJ, LaNoue KF, Levison SW. Diabetic retinopathy: more than meets the eye. Surv Ophthalmol. 2002;Suppl 2:S253–S262. - PubMed
- Klein R, Klein B, Moss S. Epidemiology of proliferative diabetic retinopathy. Diabetes Care. 1992;15:1875–1891. - PubMed
- Reynaud X, Dorey CK. Extraretinal neovascularization induced by hypoxic episodes in the neonatal rat. Invest Ophthalmol Vis Sci. 1994;35:3169–3177. - PubMed
Publication types
MeSH terms
Substances
LinkOut - more resources
Full Text Sources
Other Literature Sources
Research Materials


