Electrostatic sequestration of PIP2 on phospholipid membranes by basic/aromatic regions of proteins - PubMed (original) (raw)
Electrostatic sequestration of PIP2 on phospholipid membranes by basic/aromatic regions of proteins
Alok Gambhir et al. Biophys J. 2004 Apr.
Abstract
The basic effector domain of myristoylated alanine-rich C kinase substrate (MARCKS), a major protein kinase C substrate, binds electrostatically to acidic lipids on the inner leaflet of the plasma membrane; interaction with Ca2+/calmodulin or protein kinase C phosphorylation reverses this binding. Our working hypothesis is that the effector domain of MARCKS reversibly sequesters a significant fraction of the L-alpha-phosphatidyl-D-myo-inositol 4,5-bisphosphate (PIP2) on the plasma membrane. To test this, we utilize three techniques that measure the ability of a peptide corresponding to its effector domain, MARCKS(151-175), to sequester PIP2 in model membranes containing physiologically relevant fractions (15-30%) of the monovalent acidic lipid phosphatidylserine. First, we measure fluorescence resonance energy transfer from Bodipy-TMR-PIP2 to Texas Red MARCKS(151-175) adsorbed to large unilamellar vesicles. Second, we detect quenching of Bodipy-TMR-PIP2 in large unilamellar vesicles when unlabeled MARCKS(151-175) binds to vesicles. Third, we identify line broadening in the electron paramagnetic resonance spectra of spin-labeled PIP2 as unlabeled MARCKS(151-175) adsorbs to vesicles. Theoretical calculations (applying the Poisson-Boltzmann relation to atomic models of the peptide and bilayer) and experimental results (fluorescence resonance energy transfer and quenching at different salt concentrations) suggest that nonspecific electrostatic interactions produce this sequestration. Finally, we show that the PLC-delta1-catalyzed hydrolysis of PIP2, but not binding of its PH domain to PIP2, decreases markedly as MARCKS(151-175) sequesters most of the PIP2.
Figures
FIGURE 1
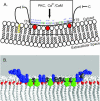
(A) Cartoon of the “natively unfolded” MARCKS protein, shown as a black line, interacting with the inner leaflet of the plasma membrane. The N-terminal myristate, shown in yellow, inserts hydrophobically into the bilayer. The MARCKS effector domain (residues 151–175 of bovine MARCKS, shown in the box) interacts electrostatically with acidic lipids (3 PIP2 shown in red) through its 13 basic residues (in blue with + signs) and hydrophobically through its five aromatic residues (in green). (B) Molecular model of a peptide corresponding to the MARCKS effector domain overlaid on a molecular model of a bilayer membrane. Experimental evidence (see text) shows that the peptide is located at the polar headgroup region in an extended conformation; the five aromatic phenylalanine residues (colored green) penetrate to the level of the acyl chains, and the highly charged N-terminal region (basic residues colored blue) is in the aqueous phase. The lipids are shown in white with the carbonyl oxygen atoms colored red to illustrate the interface between the headgroup region and the hydrocarbon interior of the membrane. The extended peptide is ∼9 nm in length.
FIGURE 2
Molecular structures of (A) Bodipy-TMR-PIP2 and (B) proxyl-PIP2 .
FIGURE 3
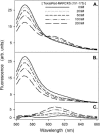
FRET from Bodipy-TMR-PIP2 to membrane-bound Texas Red MARCKS(151–175). The LUVs are formed from PC/PS/Bodipy-TMR-PIP2 (70:30:0.1). The total lipid concentration is 0.75 mM; approximately all the peptide is bound to the LUVs. Bodipy-TMR-PIP2 is excited at 547 nm. (A) Representative corrected emission spectra for the peptide concentrations indicated. Spectra are deconvoluted to two peaks: (B) the quenching of Bodipy-TMR-PIP2, centered at 571 nm, and (C) the energy transfer to Texas Red MARCKS(151–175), centered at 607 nm. The solutions in these experiments, and in those shown in the following figures (except Figs. 9 and 13), contain 100 mM KCl, 1 mM MOPS, pH 7.0.
FIGURE 4
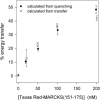
The % energy transfer versus concentration of Texas Red MARCKS(151–175). We calculate the % energy transfer from the quenching data (•) in Fig. 3 B and similar experiments, or from the energy transferred data (○) in Fig. 3 C and similar experiments. All subsequent energy transfer results are calculated using the quenching spectra. Each point shown in the graph is an average of ≥7 separate experiments (±SD).
FIGURE 5
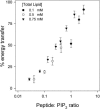
The % energy transfer for PC/PS/Bodipy-TMR-PIP2 (70:30:0.1) LUVs plotted against the molar ratio of Texas Red MARCKS(151–175) to Bodipy-TMR-PIP2. The total lipid concentrations are 0.75 mM (▾), 0.5 mM (○), and 0.1 mM (•).
FIGURE 6
The % energy transfer from Bodipy-TMR-PIP2 to Texas-Red-labeled peptides: Texas Red MARCKS(151–175) (•),Texas Red FA-MARCKS(151–175) (○), Texas Red Lys-13(▾), and Texas Red Lys-7(▿). The total lipid concentration is 0.75 mM in PC/PS/Bodipy-TMR-PIP2 (70:30:0.1) LUVs.
FIGURE 7
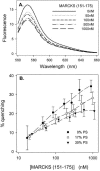
Quenching of Bodipy-TMR-PIP2 due to membrane-bound unlabeled MARCKS(151–175). Total lipid concentration is 0.1 mM. Bodipy-TMR-PIP2 is excited at 547 nm. (A) Representative experiments showing the raw emission spectra for Bodipy-TMR-PIP2 at different concentrations of MARCKS(151–175); vesicles are PC/Bodipy-TMR-PIP2 (99:1) LUVs. (B) The % quenching of Bodipy-TMR-PIP2 as a function of MARCKS(151–175) concentration on vesicles comprised of PC, 1% Bodipy-TMR-PIP2, and either 0 (•), 17% (○), or 30% (▾) PS. Each point on the plot is an average of ≥7 independent experiments.
FIGURE 8
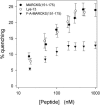
Quenching of Bodipy-TMR-PIP2 due to MARCKS(151–175) (•), Lys-13 (○), and FA-MARCKS(151–175) (▾). PC/PS/Bodipy-TMR-PIP2 (69:30:1) LUVs at a lipid concentration of 0.5 mM are sufficient to bind essentially all of the peptide.
FIGURE 9
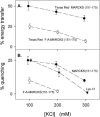
Increasing the salt concentration decreases both energy transfer and quenching. (A) Energy transfer between Bodipy-TMR-PIP2 and Texas Red MARCKS(151–175) (•) or Texas Red FA-MARCKS(151–175) (○) in solutions containing 100 mM, 200 mM, or 300 mM KCl. Lipid composition of LUVs is PC/PS/Bodipy-TMR-PIP2 (70:30:0.1). (B) Quenching of Bodipy-TMR-PIP2 due to MARCKS(151–175) (•), FA-MARCKS(151–175) (○), or Lys-13 (▾) in solutions containing 100 mM, 200 mM, or 300 mM KCl. Lipid composition of LUVs is PC/PS/Bodipy-TMR-PIP2 (69:30:1).
FIGURE 10
EPR spectra of proxyl-PIP2 in bilayers composed of (A) PC, (B) PC/PS (9:1), and (C) PC/PS (7:3) in the absence (black line) and presence (gray line) of MARCKS(151–175). The peptide was added to concentrations of ∼50, 80, and 120 _μ_M in A, B, and C, respectively. The spin label was present at ∼0.5 mol%; total lipid concentration is 20 mM; solution contains 100 mM KCl, 10 mM MOPS, pH 7.0. The amplitudes of the EPR spectra have been normalized against the total spin concentration.
FIGURE 11
Titration of the central (mI = 0) nitroxide EPR resonance, A(0), as a function of the concentration of added MARCKS(151–175). The titration is shown in vesicle suspensions of PC (○), PC/PS (9:1, ▴), PC/PS (7:3, •) at a total lipid concentration of ∼7 mM; proxyl-PIP2 is present at 0.85 mol%.
FIGURE 12
Electrostatic potentials produced by basic peptides FA-MARCKS(151–175) or Lys-13. (A) FA-MARCKS(151–175) (colored green) binds to a 5:1 PC/PS membrane; a single PIP2 (colored yellow) is visible far from the peptide in the upper right-hand side of the bilayer. The blue and red meshes show +25 and −25 mV equipotential profiles. (B) FA-MARCKS(151–175) binds to a 5:1 PC/PS membrane and sequesters a PIP2. (C) FA-MARCKS(151–175) in 100 mM KCl solution. The blue line shows a two-dimensional representation of the +25 mV equipotential profile. In panels D, E, and F the peptide is adsorbed to a 5:1 PC/PS bilayer and viewed from above. For clarity, we do not show the membrane and −25 mV potential profile. (D) FA-MARCKS(151–175) binds to a 5:1 PC/PS membrane; (E) membrane-bound FA-MARCKS(151–175) sequesters a PIP2; (F) membrane-bound Lys-13.
FIGURE 13
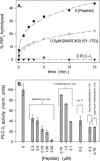
Inhibition of PLC-_δ_1-catalyzed hydrolysis of PIP2 by peptides that sequester PIP2. (A) The % accessible PIP2 hydrolyzed versus time after addition of PLC-_δ_1. These data are for zero peptide (•) and 0.5 _μ_M MARCKS(151–175) (○). A control with no PLC shows no hydrolysis (▾), as expected. The results illustrate the average of six separate experiments. (B) Bar graph of relative PLC-_δ_1 activity, calculated from the initial slopes of hydrolysis versus time curves similar to those shown in A. These bars represent an average of six experiments (±SD) for each peptide. LUVs were composed of PC/PS/3H-PIP2 (83:17:0.15); 0.2 mM total lipid concentration. Solution contains 100 mM KCl, 25 mM HEPES, 100 _μ_M EGTA, 102 _μ_M CaCl2 (∼5 _μ_M free Ca2+), 2 mM DTT, ∼10 nM PLC-_δ_1, pH 7.0.
FIGURE 14
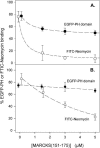
Effect of PIP2 sequestration on the binding of EGFP-PH and FITC-Neomycin to LUVs. (A) Binding of EGFP-PH domain from PLC-_δ_1 (•) or FITC-Neomycin (○) to PC/PIP2 (99:1) LUVs plotted against MARCKS(151–175) concentration. Lipid concentration 0.8 mM; EGFP-PH domain or FITC-Neomycin concentration ∼10 nM. Solutions contain 100 mM KCl, 1 mM MOPS, 100 _μ_M EDTA, 2 mM DTT, 0.0065% Triton X-100, pH 7.0. (B) Binding of EGFP-PH domain (•) or FITC-Neomycin (○) to PC/PS/PIP2 (79:20:1) LUVs. All data points are an average of nine experiments (±SD).
FIGURE 15
MARCKS(151–175) laterally sequesters the PIP2-bound PH domain of PLC-_δ_1 as well as PIP2. (A) See text for description of cartoon. Equilibrium 1: membrane-bound MARCKS(151–175) (blue ovals represent the 13 basic residues; green ovals the five phenylalanine residues) laterally sequesters PIP2 (red). Equilibrium 2: The PLC-_δ_1 PH domain (light green) binds to PIP2 (red) with high specificity; PIP2 forms multiple hydrogen bonds with positively charged residues (blue + signs) in the binding pocket. Equilibrium 3: We propose that the PIP2-bound PH domain, which contains a patch of acidic residues (red − signs) on its surface, is (like PIP2) sequestered electrostatically by the membrane-bound MARCKS(151–175). Panel B shows the potential produced by PIP2 (yellow) on a PC membrane. Panel C shows the potential produced by PIP2-bound PH domain (green) on a PC membrane as viewed from the side. Panel D illustrates the view from the top of the membrane: −25 mV and +25 mV potential profiles are shown in red and blue; salt concentration = 100 mM.
FIGURE 16
Texas Red MARCKS(151–175) permeates giant unilamellar vesicles. We observed Texas Red fluorescence immediately (∼10 s) after addition of Texas Red MARCKS(151–175) to a solution containing a giant (∼10 _μ_m) vesicle enclosing four smaller vesicles. Epi-fluorescence microscopy reveals Texas Red MARCKS(151–175) binds rapidly to the inner vesicles. Lipid composition: PC/PS/PIP2 (69:30:0.1); peptide concentration: ∼100 nM.
Similar articles
- Myristoylated alanine-rich C kinase substrate (MARCKS) produces reversible inhibition of phospholipase C by sequestering phosphatidylinositol 4,5-bisphosphate in lateral domains.
Glaser M, Wanaski S, Buser CA, Boguslavsky V, Rashidzada W, Morris A, Rebecchi M, Scarlata SF, Runnels LW, Prestwich GD, Chen J, Aderem A, Ahn J, McLaughlin S. Glaser M, et al. J Biol Chem. 1996 Oct 18;271(42):26187-93. doi: 10.1074/jbc.271.42.26187. J Biol Chem. 1996. PMID: 8824266 - A computational model for the electrostatic sequestration of PI(4,5)P2 by membrane-adsorbed basic peptides.
Wang J, Gambhir A, McLaughlin S, Murray D. Wang J, et al. Biophys J. 2004 Apr;86(4):1969-86. doi: 10.1016/S0006-3495(04)74260-5. Biophys J. 2004. PMID: 15041641 Free PMC article. - Lateral sequestration of phosphatidylinositol 4,5-bisphosphate by the basic effector domain of myristoylated alanine-rich C kinase substrate is due to nonspecific electrostatic interactions.
Wang J, Gambhir A, Hangyás-Mihályné G, Murray D, Golebiewska U, McLaughlin S. Wang J, et al. J Biol Chem. 2002 Sep 13;277(37):34401-12. doi: 10.1074/jbc.M203954200. Epub 2002 Jul 3. J Biol Chem. 2002. PMID: 12097325 - Reversible - through calmodulin - electrostatic interactions between basic residues on proteins and acidic lipids in the plasma membrane.
McLaughlin S, Hangyás-Mihályné G, Zaitseva I, Golebiewska U. McLaughlin S, et al. Biochem Soc Symp. 2005;(72):189-98. doi: 10.1042/bss0720189. Biochem Soc Symp. 2005. PMID: 15649142 Review. - The MARCKS family of phospholipid binding proteins: regulation of phospholipase D and other cellular components.
Sundaram M, Cook HW, Byers DM. Sundaram M, et al. Biochem Cell Biol. 2004 Feb;82(1):191-200. doi: 10.1139/o03-087. Biochem Cell Biol. 2004. PMID: 15052337 Review.
Cited by
- Structural basis and mechanism of autoregulation in 3-phosphoinositide-dependent Grp1 family Arf GTPase exchange factors.
DiNitto JP, Delprato A, Gabe Lee MT, Cronin TC, Huang S, Guilherme A, Czech MP, Lambright DG. DiNitto JP, et al. Mol Cell. 2007 Nov 30;28(4):569-83. doi: 10.1016/j.molcel.2007.09.017. Mol Cell. 2007. PMID: 18042453 Free PMC article. - CapZ-lipid membrane interactions: a computer analysis.
Smith J, Diez G, Klemm AH, Schewkunow V, Goldmann WH. Smith J, et al. Theor Biol Med Model. 2006 Aug 16;3:30. doi: 10.1186/1742-4682-3-30. Theor Biol Med Model. 2006. PMID: 16914033 Free PMC article. - Lateral dynamics of proteins with polybasic domain on anionic membranes: a dynamic Monte-Carlo study.
Kiselev VY, Marenduzzo D, Goryachev AB. Kiselev VY, et al. Biophys J. 2011 Mar 2;100(5):1261-70. doi: 10.1016/j.bpj.2011.01.025. Biophys J. 2011. PMID: 21354399 Free PMC article. - Sequestration of phosphoinositides by mutated MARCKS effector domain inhibits stimulated Ca(2+) mobilization and degranulation in mast cells.
Gadi D, Wagenknecht-Wiesner A, Holowka D, Baird B. Gadi D, et al. Mol Biol Cell. 2011 Dec;22(24):4908-17. doi: 10.1091/mbc.E11-07-0614. Epub 2011 Oct 19. Mol Biol Cell. 2011. PMID: 22013076 Free PMC article. - Multivalent Cation-Bridged PI(4,5)P2 Clusters Form at Very Low Concentrations.
Wen Y, Vogt VM, Feigenson GW. Wen Y, et al. Biophys J. 2018 Jun 5;114(11):2630-2639. doi: 10.1016/j.bpj.2018.04.048. Biophys J. 2018. PMID: 29874613 Free PMC article.
References
- Aderem, A. 1992. The MARCKS brothers: a family of protein kinase C substrates. Cell. 71:713–716. - PubMed
- Arbuzova, A., K. Martushova, G. Hangyas-Mihalyne, A. J. Morris, S. Ozaki, G. D. Prestwich, and S. McLaughlin. 2000a. Fluorescently labeled neomycin as a probe of phosphatidylinositol-4, 5-bisphosphate in membranes. Biochim. Biophys. Acta. 1464:35–48. - PubMed
Publication types
MeSH terms
Substances
Grants and funding
- R37 GM024971/GM/NIGMS NIH HHS/United States
- R01 GM069651/GM/NIGMS NIH HHS/United States
- GM24971/GM/NIGMS NIH HHS/United States
- GM62305/GM/NIGMS NIH HHS/United States
- GM69651/GM/NIGMS NIH HHS/United States
- T32 GM008444/GM/NIGMS NIH HHS/United States
- R01 GM024971/GM/NIGMS NIH HHS/United States
- R01 GM062305/GM/NIGMS NIH HHS/United States
LinkOut - more resources
Full Text Sources
Other Literature Sources
Miscellaneous
