Diastolic calcium release controls the beating rate of rabbit sinoatrial node cells: numerical modeling of the coupling process - PubMed (original) (raw)
Diastolic calcium release controls the beating rate of rabbit sinoatrial node cells: numerical modeling of the coupling process
Victor A Maltsev et al. Biophys J. 2004 Apr.
Abstract
Recent studies employing Ca2+ indicators and confocal microscopy demonstrate substantial local Ca2+ release beneath the cell plasma membrane (subspace) of sinoatrial node cells (SANCs) occurring during diastolic depolarization. Pharmacological and biophysical experiments have suggested that the released Ca2+ interacts with the plasma membrane via the ion current (INaCa) produced by the Na+/Ca2+ exchanger and constitutes an important determinant of the pacemaker rate. This study provides a numerical validation of the functional importance of diastolic Ca2+ release for rate control. The subspace Ca2+ signals in rabbit SANCs were measured by laser confocal microscopy, averaged, and calibrated. The time course of the subspace [Ca2+] displayed both diastolic and systolic components. The diastolic component was mainly due to the local Ca2+ releases; it was numerically approximated and incorporated into a SANC cellular electrophysiology model. The model predicts that the diastolic Ca2+ release strongly interacts with plasma membrane via INaCa and thus controls the phase of the action potential upstroke and ultimately the final action potential rate.
Figures
FIGURE 1
Ca2+ signals across the cells as identified by line-scanning confocal microscopy. The scan line was oriented across the cell so that it crossed the longitudinal axis of the cell at approximately one-half of the cell depth (inset). Arrows on the confocal image show local Ca2+ releases in the submembrane space during diastolic depolarization. The blue line shows simultaneous recording of the membrane potential measured by the perforated patch-clamp technique.
FIGURE 2
Ca2+ signaling identified by confocal line-scan imaging of SANCs in a subsarcolemmal space. The scanned line was oriented along to the longitudinal axis of the cell close to the plasma membrane (inset). The diastolic Ca2+ releases are indicated by arrows on the image. The respective trace of the average Ca2+ signal (in F/_F_0 scale) processed from the whole image width is shown on the bottom panel.
FIGURE 3
The two distinct components of Ca2+ signaling in submembrane space: D, the diastolic Ca2+ release and S, the systolic Ca2+ release (right panels), as identified by averaging the raw F/_F_0 traces (superimposed, left panels) recorded by line-scanning confocal microscopy in four cells. The traces were split into two-cycle fragments by custom-made software and centered, assigning time = 0 for the peak in the middle (see dashed line marked as t = 0). Numbers of superimposed traces are 15, 9, 8, and 14 (left panels, from top to bottom).
FIGURE 4
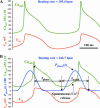
Increase in SANC beating rate on introduction of the spontaneous Ca2+ release component, _j_spont, described by Eq. 2 (see text), into the model. (A) Subspace [Ca2+], _Ca_sub, and membrane potential, _V_m, generated by the original model of Kurata et al. (2002) from Eq. 1. (B) _Ca_sub and _V_m simulations of the same model but with introduced spontaneous Ca2+ release. The time course for _P_phase(t), described by Eq. 3, is also shown (blue line). The beating rate increased from 195.4 bpm to 246.7 bpm with the introduction of _j_spont with the following parameters: _P_rel,spont = 5 ms−1, _t_width = 150 ms, and _t_phase = 150 ms.
FIGURE 5
Our variant of SANC model with the diastolic Ca2+ release and adjusted membrane conductance and Ca2+ handling parameters to be in line with experimental data (left side marked as _+ Spontaneous Ca_2+ Release) and its negative chronotropic response on the complete blockade of the spontaneous release (_j_spont = 0) simulating ryanodine effect. Shown are simulated traces for subspace [Ca2+], _Ca_sub, and membrane potential, _V_m, changes. For model parameters see text. T is the action potential period; bpm is beats per min.
FIGURE 6
The AP upstroke phase follows the phase of spontaneous Ca2+ release (_t_phase) upon introduction of spontaneous Ca2+ release into the model. Shown are superimposed simulated traces of [Ca2+] changes in subspace (_Ca_sub) along with respective APs generated with varying phase of the diastolic release (_t_phase, shown at peaks of _Ca_sub traces). (Inset) Plot of the first AP period (T) as a function, _t_phase.
FIGURE 7
The phase and the amplitude of the diastolic Ca2+ release control the steady-state rate of AP firing. The family of plots shows relationships of cycle period (or respective SANC rate, right scale) versus the phase of the diastolic release (_t_phase in Eq. 3) for various Ca2+ release amplitude determined by _P_rel,spont (in ms−1) in Eq. 2.
FIGURE 8
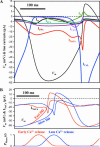
NCX transmits Ca2+ signals to the plasma membrane. (A) Complete AP cycle (_V_m) along with simulated ion currents that have inward direction during diastolic depolarization (DD), namely, current produced by the Na+/Ca2+ exchanger, _I_NaCa; L-type Ca2+ current, _I_CaL; T-type Ca2+ current, _I_CaT; background Na+ and Ca2+ currents _I_bNa and _I_bCa; hyperpolarization-activated _I_f current; and sustained inward current, _I_st. _I_NaCa remains the largest inward current during DD until the membrane potential reaches −32.8 mV (i.e., _I_CaL activation threshold). _I_CaL is shown truncated. (B) Two sets of superimposed simulations generated for normal and late spontaneous release occurrence (red and blue lines, respectively). When spontaneous release is late, _I_NaCa is relatively small and DD significantly slows (Slow DD). Each set displays simulated traces of _I_NaCa, membrane potential, _V_m, and the phase of spontaneous Ca2+ release, _P_phase(t), as defined by Eq. 3.
Similar articles
- Membrane potential fluctuations resulting from submembrane Ca2+ releases in rabbit sinoatrial nodal cells impart an exponential phase to the late diastolic depolarization that controls their chronotropic state.
Bogdanov KY, Maltsev VA, Vinogradova TM, Lyashkov AE, Spurgeon HA, Stern MD, Lakatta EG. Bogdanov KY, et al. Circ Res. 2006 Oct 27;99(9):979-87. doi: 10.1161/01.RES.0000247933.66532.0b. Epub 2006 Sep 28. Circ Res. 2006. PMID: 17008599 - High basal protein kinase A-dependent phosphorylation drives rhythmic internal Ca2+ store oscillations and spontaneous beating of cardiac pacemaker cells.
Vinogradova TM, Lyashkov AE, Zhu W, Ruknudin AM, Sirenko S, Yang D, Deo S, Barlow M, Johnson S, Caffrey JL, Zhou YY, Xiao RP, Cheng H, Stern MD, Maltsev VA, Lakatta EG. Vinogradova TM, et al. Circ Res. 2006 Mar 3;98(4):505-14. doi: 10.1161/01.RES.0000204575.94040.d1. Epub 2006 Jan 19. Circ Res. 2006. PMID: 16424365 - Spontaneous, local diastolic subsarcolemmal calcium releases in single, isolated guinea-pig sinoatrial nodal cells.
Sirenko SG, Yang D, Maltseva LA, Kim MS, Lakatta EG, Maltsev VA. Sirenko SG, et al. PLoS One. 2017 Sep 25;12(9):e0185222. doi: 10.1371/journal.pone.0185222. eCollection 2017. PLoS One. 2017. PMID: 28945810 Free PMC article. - Rhythmic Ca2+ oscillations drive sinoatrial nodal cell pacemaker function to make the heart tick.
Vinogradova TM, Maltsev VA, Bogdanov KY, Lyashkov AE, Lakatta EG. Vinogradova TM, et al. Ann N Y Acad Sci. 2005 Jun;1047:138-56. doi: 10.1196/annals.1341.013. Ann N Y Acad Sci. 2005. PMID: 16093492 Review. - The role of Na-Ca exchange current in the cardiac action potential.
Janvier NC, Boyett MR. Janvier NC, et al. Cardiovasc Res. 1996 Jul;32(1):69-84. Cardiovasc Res. 1996. PMID: 8776405 Review.
Cited by
- Integrative modeling of the cardiac ventricular myocyte.
Winslow RL, Cortassa S, O'Rourke B, Hashambhoy YL, Rice JJ, Greenstein JL. Winslow RL, et al. Wiley Interdiscip Rev Syst Biol Med. 2011 Jul-Aug;3(4):392-413. doi: 10.1002/wsbm.122. Epub 2010 Sep 23. Wiley Interdiscip Rev Syst Biol Med. 2011. PMID: 20865780 Free PMC article. Review. - Effect of K201, a novel antiarrhythmic drug on calcium handling and arrhythmogenic activity of pulmonary vein cardiomyocytes.
Chen YJ, Chen YC, Wongcharoen W, Lin CI, Chen SA. Chen YJ, et al. Br J Pharmacol. 2008 Mar;153(5):915-25. doi: 10.1038/sj.bjp.0707564. Epub 2007 Nov 12. Br J Pharmacol. 2008. PMID: 17994112 Free PMC article. - Genetic isolation of stem cell-derived pacemaker-nodal cardiac myocytes.
Hashem SI, Claycomb WC. Hashem SI, et al. Mol Cell Biochem. 2013 Nov;383(1-2):161-71. doi: 10.1007/s11010-013-1764-x. Epub 2013 Jul 23. Mol Cell Biochem. 2013. PMID: 23877224 - Inhibition of spontaneous activity of rabbit atrioventricular node cells by KB-R7943 and inhibitors of sarcoplasmic reticulum Ca(2+) ATPase.
Cheng H, Smith GL, Hancox JC, Orchard CH. Cheng H, et al. Cell Calcium. 2011 Jan;49(1):56-65. doi: 10.1016/j.ceca.2010.11.008. Epub 2010 Dec 15. Cell Calcium. 2011. PMID: 21163524 Free PMC article. - Modern perspectives on numerical modeling of cardiac pacemaker cell.
Maltsev VA, Yaniv Y, Maltsev AV, Stern MD, Lakatta EG. Maltsev VA, et al. J Pharmacol Sci. 2014;125(1):6-38. doi: 10.1254/jphs.13r04cr. Epub 2014 Apr 19. J Pharmacol Sci. 2014. PMID: 24748434 Free PMC article. Review.
References
- Bogdanov, K. Y., T. M. Vinogradova, and E. G. Lakatta. 2001. Sinoatrial nodal cell ryanodine receptor and Na-Ca exchanger: molecular partners in pacemaker regulation. Circ. Res. 88:1254–1258. - PubMed
- Bucchi, A., M. Baruscotti, R. B. Robinson, and D. DiFrancesco. 2003. If-dependent modulation of pacemaker rate mediated by cAMP in the presence of ryanodine in rabbit sino-atrial node cells. J. Mol. Cell. Cardiol. 35:905–913. - PubMed
- Fan, J.-S., and P. Palade. 1998. Perforated patch recording with β-escin. Pflugers Arch. Eur. J. Physiol. 436:1021–1023. - PubMed
- Fruen, B. R., J. M. Bardy, T. M. Byrem, G. M. Strasburg, and C. F. Louis. 2000. Differential Ca2+ sensitivity of skeletal and cardiac muscle ryanodine receptors in the presence of calmodulin. Am. J. Physiol. Cell Physiol. 279:C724–C733. - PubMed
MeSH terms
Substances
LinkOut - more resources
Full Text Sources
Miscellaneous


