Role of NF-kappa B in cell survival and transcription of latent membrane protein 1-expressing or Epstein-Barr virus latency III-infected cells - PubMed (original) (raw)
Role of NF-kappa B in cell survival and transcription of latent membrane protein 1-expressing or Epstein-Barr virus latency III-infected cells
Ellen D Cahir-McFarland et al. J Virol. 2004 Apr.
Abstract
Epstein-Barr virus (EBV) latency III infection converts B lymphocytes into lymphoblastoid cell lines (LCLs) by expressing EBV nuclear and membrane proteins, EBNAs, and latent membrane proteins (LMPs), which regulate transcription through Notch and tumor necrosis factor receptor pathways. The role of NF-kappa B in LMP1 and overall EBV latency III transcriptional effects was investigated by treating LCLs with BAY11-7082 (BAY11). BAY11 rapidly and irreversibly inhibited NF-kappa B, decreased mitochondrial membrane potential, induced apoptosis, and altered LCL gene expression. BAY11 effects were similar to those of an NF-kappa B inhibitor, Delta N-I kappa B alpha, in effecting decreased JNK1 expression and in microarray analyses. More than 80% of array elements that decreased with Delta N-I kappa B alpha expression decreased with BAY11 treatment. Newly identified NF-kappa B-induced, LMP1-induced, and EBV-induced genes included pleckstrin, Jun-B, c-FLIP, CIP4, and I kappa B epsilon. Of 776 significantly changed array elements, 134 were fourfold upregulated in EBV latency III, and 74 were fourfold upregulated with LMP1 expression alone, whereas only 28 were more than fourfold downregulated by EBV latency III. EBV latency III-regulated gene products mediate cell migration (EBI2, CCR7, RGS1, RANTES, MIP1 alpha, MIP1 beta, CXCR5, and RGS13), antigen presentation (major histocompatibility complex proteins and JAW1), mitogen-activated protein kinase pathway (DUSP5 and p62Dok), and interferon (IFN) signaling (IFN-gamma R alpha, IRF-4, and STAT1). Comparison of EBV latency III LCL gene expression to immunoglobulin M (IgM)-stimulated B cells, germinal-center B cells, and germinal-center-derived lymphomas clustered LCLs with IgM-stimulated B cells separately from germinal-center cells or germinal-center lymphoma cells. Expression of IRF-2, AIM1, ASK1, SNF2L2, and components of IFN signaling pathways further distinguished EBV latency III-infected B cells from IgM-stimulated or germinal-center B cells.
Figures
FIG. 1.
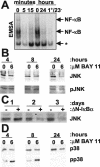
(A) BAY11 inhibition of NF-κB in LCLs. Electrophoretic mobility shift assay with cell lysates after treatment for the indicated times with DMSO (lanes 1 and 4) or 10 μM BAY11 (lanes 2, 3, 5, and 6). In lane 6, cells were treated with BAY11 for only 1 h. The asterisk indicates a nonspecific complex. (B) BAY11 slowly downregulates JNK expression in LCLs. LCLs were treated with DMSO or 6 μM BAY11 for 4, 8, or 24 h. Total cell lysates were analyzed by using JNK (top) or phospho-JNK (bottom) antibodies. (C) JNK1 expression is downregulated by ΔN-IκBα. IB4 cells that conditionally express ΔN-IκBα under TET control were induced for 1, 2, or 3 days. Total cell extracts were examined for JNK expression. (D) BAY11 augments p38 activity. Cells were treated as in panel B. Western blot analyses were performed with antibodies to p38 (top) or phospho-p38 (bottom).
FIG. 2.
BAY11 treatment of LCLs causes loss of MMP and apoptosis. (A) LCLs were treated with DMSO or 10 μM BAY11 for 16 h. DiOC6 staining (indicative of MMP) of propidium iodide-negative cells was compared to forward light scatter (indicative of cell size). (B) LCLs were treated with DMSO or 10 μM BAY11 for 24 h, fixed, and stained with propidium iodide for DNA content and analyzed by FACS. (C) A portion of cells from panel B were examined by confocal microscopy.
FIG. 3.
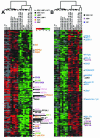
Transcriptional profiling by using Lymphochip. (A) Clustering of 776 significantly changed array elements. EBV-induced array elements are indicated by a red bar; EBV-repressed array elements are indicated by a green bar; LMP1-induced array elements are indicated by the yellow and black bar; LMP1-repressed array elements are indicated by a purple and black bar; NF-κB-induced array elements are indicated by a black bar; EBV-induced, LMP1-induced, and NF-κB induced array elements are indicated by a blue bar; EBV-induced, LMP1-induced, and NF-κB-repressed array elements are indicated by a pink bar; and ferritin light-chain array elements are indicated by the aqua bar. (B) 47 EBV-induced, LMP-1 induced and NF-κB induced array elements. For both panels A and B, the lanes were as follows. Lanes 1 to 11 show the results with mRNAs compared to a reference lymphopool mRNA. Lanes 1, 2, and 3 show the findings for Ramos, BL30, and BL2 cells, respectively. Lanes 4 and 5 show the results for the recently established LCL2 and LCL14 lines. Lanes 6 and 7 show the results for IB4, lanes 8 and 9 show the results for BL41, and lanes 10 and 11 show the results for BL41EBV. Lanes 12 and 13 show the findings for mRNAs at 24 h after LMP1 induction. Lane 14 shows the findings for mRNAs at 10 h after induction. Lanes 12 to 14 show a direct comparison to the nonexpressing condition at the same time points. In lanes 15 to 17, mRNAs are compared to a reference lymphopool mRNA. Lane 15 and 16 show results for mRNAs from conditionally expressing ΔN-IκBα IB4 cells with high levels of NF-κB activity, i.e., with ΔN-IκBα repressed for 24 h or from the initiation of the experiment. Lane 17 shows the results for mRNAs from the same cells with low NF-κB activity due to the expression of ΔN-IκBα for 24 h. In lanes 18 to 24, mRNAs from the low-NF-κB condition are directly compared to mRNAs from the high-NF-κB condition. In lanes 18 and 19, the results are for 24 h of ΔN-IκBα expression in IB4 cells; in lanes 20 and 21, the results are for 16 and 8 h of expression, respectively. mRNA abundance was directly compared between BAY11- and DMSO-treated LCLs for 8 h. Lane 22 shows the findings for mRNAs from LCL4 that was treated with 3 μM BAY11. Lanes 23 and 24 show the findings from two independent experiments in which IB4 was treated with 6 μM BAY11. Groups that were arrayed in comparison to lymphopool RNA and then mean centered together are indicated at the top in gray. The letter “D” indicates RNAs are compared directly. cDNAs with an asterisk have Q values between 2 and 5%; those without an asterisk have Q values of <2%.
FIG. 4.
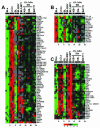
Genes that change ≥4-fold with EBV infection or LMP1 expression. (A) EBV-induced genes; (B) EBV-repressed genes; (C) LMP1-induced genes. No genes were repressed by LMP1 fourfold. Arrays are arranged as described for Fig. 3. Groups that were arrayed in comparison to lymphopool RNA and then mean centered together are indicated in gray. The letter “D” indicates RNAs were compared directly. cDNAs with an asterisk have Q values of between 2 and 5%; those without an asterisk have Q values of <2%.
FIG.5.
LCLs are more similar to IgM-stimulated B cells than germinal-center B cells or diffuse large-cell lymphomas (DLCLs). mRNAs abundance for 3,399 cDNAs was compared among LCLs (lanes 1 to 4), IgM-stimulated B cells (lanes 5 to 9), germinal-center B cells (lanes 10 to 11), DLCLs (lanes 12 and 16 to 18), and BL cells (lanes 13 to 15). Cluster analysis determined the order of the arrays shown by the array tree. Two nodes exemplifying the differences between the two main branches of the array tree are shown. (A) Genes highly expressed in LCLs and IgM-stimulated B cells. Genes labeled in pink were identified as EBV induced, genes labeled in orange were identified as part of an activated signature, genes labeled in green were identified as LMP1 induced, genes labeled in purple were identified as EBV and LMP1 induced, genes labeled in black were identified as EBV induced and part of the activated signature, and genes labeled with asterisks were identified as EBV induced, LMP1 induced, and part of the activation signature. (B) Genes expressed at low levels in LCLs and IgM-stimulated B cells. Genes labeled in purple were identified as EBV repressed, genes labeled in blue were identified as part of the germinal-center signature, and genes labeled in black were identified as both EBV repressed and part of the germinal-center signature.
FIG. 6.
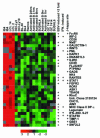
EBV latency III distinguishers. Genes expressed at high levels in LCLs and not in IgM-stimulated B cells or germinal-center cells. Genes identified as EBV induced by ≥2-fold in these studies are indicated. The genes were identified as IFN responsive in a separate study (21). Genes with GTGGGAA within 5 kb 5′ of the transcriptional start site are indicated. cDNAs with an asterisk have a Q value of between 2 and 5%; those without an asterisk have Q values of <2%.
References
- Alizadeh, A., M. Eisen, D. Botstein, P. O. Brown, and L. M. Staudt. 1998. Probing lymphocyte biology by genomic-scale gene expression analysis. J. Clin. Immunol. 18:373-379. - PubMed
- Alizadeh, A., M. Eisen, R. E. Davis, C. Ma, H. Sabet, T. Tran, J. I. Powell, L. Yang, G. E. Marti, D. T. Moore, J. R. Hudson, Jr., W. C. Chan, T. Greiner, D. Weisenburger, J. O. Armitage, I. Lossos, R. Levy, D. Botstein, P. O. Brown, and L. M. Staudt. 1999. The Lymphochip: a specialized cDNA microarray for the genomic-scale analysis of gene expression in normal and malignant lymphocytes. Cold Spring Harbor Symp. Quant. Biol. 64:71-78. - PubMed
- Alizadeh, A. A., M. B. Eisen, R. E. Davis, C. Ma, I. S. Lossos, A. Rosenwald, J. C. Boldrick, H. Sabet, T. Tran, X. Yu, J. I. Powell, L. Yang, G. E. Marti, T. Moore, J. Hudson, Jr., L. Lu, D. B. Lewis, R. Tibshirani, G. Sherlock, W. C. Chan, T. C. Greiner, D. D. Weisenburger, J. O. Armitage, R. Warnke, L. M. Staudt, et al. 2000. Distinct types of diffuse large B-cell lymphoma identified by gene expression profiling. Nature 403:503-511. - PubMed
- Ardeshna, K. M., A. R. Pizzey, S. Devereux, and A. Khwaja. 2000. The PI3 kinase, p38 SAP kinase, and NF-κB signal transduction pathways are involved in the survival and maturation of lipopolysaccharide-stimulated human monocyte-derived dendritic cells. Blood 96:1039-1046. - PubMed
- Avila-Carino, J., S. Torsteinsdottir, B. Ehlin-Henriksson, G. Lenoir, G. Klein, E. Klein, and M. G. Masucci. 1987. Paired Epstein-Barr virus (EBV)-negative and EBV-converted Burkitt lymphoma lines: stimulatory capacity in allogeneic mixed lymphocyte cultures. Int. J. Cancer 40:691-697. - PubMed
Publication types
MeSH terms
Substances
Grants and funding
- CA87661/CA/NCI NIH HHS/United States
- R01 CA047006/CA/NCI NIH HHS/United States
- T32 GM007753/GM/NIGMS NIH HHS/United States
- CA85180/CA/NCI NIH HHS/United States
- P01 CA087661/CA/NCI NIH HHS/United States
- R35 CA047006/CA/NCI NIH HHS/United States
- CA47006/CA/NCI NIH HHS/United States
- R01 CA085180/CA/NCI NIH HHS/United States
LinkOut - more resources
Full Text Sources
Other Literature Sources
Molecular Biology Databases
Research Materials
Miscellaneous


