Cocaine exposure decreases GABA neuron migration from the ganglionic eminence to the cerebral cortex in embryonic mice - PubMed (original) (raw)
Cocaine exposure decreases GABA neuron migration from the ganglionic eminence to the cerebral cortex in embryonic mice
James E Crandall et al. Cereb Cortex. 2004 Jun.
Abstract
Recurrent exposure of the developing fetus to cocaine produces persistent alterations in structure and function of the cerebral cortex. Neurons of the cerebral cortex are derived from two sources: projection neurons from the neuroepithelium of the dorsal pallium and interneurons from the ganglionic eminence of the basal telencephalon. The interneurons are GABAergic and reach the cerebral cortex via a tangential migratory pathway. We found that recurrent, transplacental exposure of mouse embryos to cocaine from embryonic day 8 to 15 decreases tangential neuronal migration and results in deficits in GABAergic neuronal populations in the embryonic cerebral wall. GABAergic neurons of the olfactory bulb, which are derived from the ganglionic eminence via the rostral migratory pathway, are not affected by the cocaine exposure suggesting a degree of specificity in the effects of cocaine on neuronal migration. Thus, one mechanism by which prenatal cocaine exposure exerts deleterious effects on cerebral cortical development may be by decreasing GABAergic neuronal migration from the ganglionic eminence to the cerebral wall. The decreased GABA neuron migration may contribute to persistent structural and functional deficits observed in the exposed offspring.
Figures
Figure 1
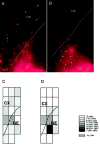
Distribution of DiI-labeled cells in slice preparations from E15 mice maintained for 2 days in vitro (A, B) and a graphical representation of the extent of DiI-labeled cell migration in ‘typical’ SAL and COC-40 slices (C, D). The DiI was deposited in the ganglionic eminence (GE) after plating the slices. There are fewer DiI-labeled cells in the cortex in the slice from the COC-40 group (B) compared to the slice from the SAL group (A), although many labeled cells are present close to the injection site in both slices. To obtain a quantitative measure of the overall extent of DiI-labeled cell migration in the slices and to give a visual indication of the extent of neuronal migration, we overlaid a grid of rectangles or boxes on the microscopic image of the slices (C, D). We calculated the percentage of DiI-labeled cells in each grid box (as a percentage of the total number of labeled cells in the slice). The percentage was coded in 5% increments of gray values (see the gray scale legend to the right of D) and a pictorial representation of the gray scale was prepared. The majority (>30%) of the DiI-labeled cells are in the box closest to the injection site (GE) in the COC-40 case (D). In the slice from the SAL case (C), the DiI-labeled cells are dispersed widely such that no single box contains more than 15% of the cells. C and D are oriented in the same direction as A and B. The dotted lines in A and B indicate the pial surface, and the solid lines in A, B, C and D indicate the boundary between the cerebral wall and the ganglionic eminence or ventricular surface. CX = cerebral cortex.
Figure 2
Mean ± SEM values for the percentage of DiI-labeled cells entering the cerebral wall in slice preparations maintained in vitro. DiI was deposited in the ganglionic eminence. * = value is significantly different (P < 0.05) from the SAL group and + = value is significantly different from the SPF-40 group. Statistical significance between two groups was analyzed using the Tukey–Kramer test. The data were obtained from 6–10 slices for each of the experimental groups.
Figure 3
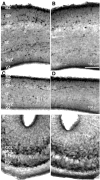
Photomicrographs of coronal sections through the medial prefrontal cortex (A, B), somatosensory cortex (C, D) and olfactory bulb (E, F) of E15 mouse embryos from the SAL (left panel) and COC-40 (right panel) groups, processed for GABA immunohistochemistry. GABA positive cells appear dark and are distributed throughout the cerebral wall and olfactory bulb. There are fewer GABA-positive profiles in the COC-40 group compared to the SAL group in the medial prefrontal and somatosensory regions. The numbers of GABA-positive profiles appear to be similar in the olfactory bulbs of the SAL and COC-40 mice. Abbreviations: VZ = ventricular zone; SVZ = subventricular zone; IZ = intermediate zone; SP = subplate; CP = cortical plate; MZ = marginal zone; GCL = glomerular cell layer; MCL = mitral cell layer; EPL = external plexiform layer; PGL = periglomerular layer; NL = nuclear layer.
Figure 4
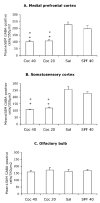
Mean ± SEM values for numerical densities of GABA-positive cells in the presumptive medial prefrontal cortex (A), somatosensory cortex (B) and the olfactory bulb (C) of E15 mice in the four experimental groups. * = value is significantly different (P < 0.05) from the SAL group and + = value is significantly different from the SPF-40 group. Statistical significance between two groups was analyzed using the Tukey–Kramer test. Sections from 5–7 brains were analyzed for each experimental group.
Figure 5
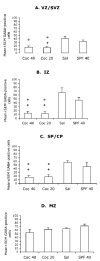
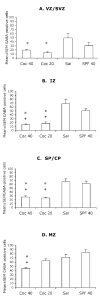
Mean ± SEM values for numerical densities of GABA-positive cells in the different laminae of the presumptive medial prefrontal cortical region of E15 mice in the four experimental groups. VZ/SVZ = ventricular and subventricular zones; IZ = intermediate zone; SP/CP = subplate and cortical plate; MZ = marginal zone. * = value is significantly different (P < 0.05) from the SAL group and + = value is significantly different from the SPF-40 group. Statistical significance between two groups was analyzed using the Tukey–Kramer test. Sections from 5–7 brains were analyzed for each experimental group.
Figure 6
Mean ± SEM values for numerical densities of GABA-positive cells in the different laminae of the presumptive somatosensory cortical region of E15 mice in the four experimental groups. VZ/SVZ = ventricular and subventricular zones; IZ = intermediate zone; SP/CP = subplate and cortical plate; MZ = marginal zone. * = value is significantly different (P < 0.05) from the SAL group and + = value is significantly different from the SPF-40 group. Statistical significance between two groups was analyzed using the Tukey-Kramer test. Sections from 5–7 brains were analyzed for each experimental group.
Figure 7
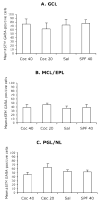
Mean ± SEM values for numerical density of GABA-positive cells in the different laminae of the olfactory bulb of E15 mice in the four experimental groups. GCL = glomerular cell layer; MCL/EPL = mitral cell layer and external plexiform layer; PGL/NL = periglomerular layer and nerve layer. The differences among the 4 groups were not statistically significant (P > 0.05). Sections from 5–7 brains were analyzed for each experimental group.
Figure 8
Mean ± SEM values for the radial dimension (thickness) of the presumptive medial prefrontal cortex (A) and the somatosensory cortex (B) of E15 mice in the four experimental groups. The differences were not statistically significant (P > 0.05). Sections from 5–7 brains were analyzed for each experimental group.
Figure 9
Photomicrographs of 4 μm thick, paraffin embedded coronal sections of the lateral ganglionic eminence (LGE; A, B), medial ganglionic eminence (MGE; D, E) and medial prefrontal cortex (MPFC; G, H) from E15 mice in the SAL (A, D, G) and COC-40 (B, E, H) groups. The sections were processed for BrdU immunohistochemistry using cobalt-nickel intensification of the diaminobenzidine reaction product and stained with basic fuchsin. BrdU-labeled nuclei appear black and the basic fuchsin stained nuclei appear pale gray. The micrographs are oriented such that the ventricular border is at the bottom and the pial surface toward the top. Sections such as these were used to calculate the BrdU labeling indices. Mean ± SEM values for 2.0 hr BrdU labeling index in the LGE (C), MGE (F) and MPFC (I) are shown. The differences among the groups were not statistically significant (P > 0.05). Four sections from each region of each of four or five brains per experimental group were analyzed.
Similar articles
- Cocaine causes deficits in radial migration and alters the distribution of glutamate and GABA neurons in the developing rat cerebral cortex.
Lee CT, Chen J, Worden LT, Freed WJ. Lee CT, et al. Synapse. 2011 Jan;65(1):21-34. doi: 10.1002/syn.20814. Synapse. 2011. PMID: 20506319 Free PMC article. - Transient maternal hypothyroxinemia at onset of corticogenesis alters tangential migration of medial ganglionic eminence-derived neurons.
Cuevas E, Ausó E, Telefont M, Morreale de Escobar G, Sotelo C, Berbel P. Cuevas E, et al. Eur J Neurosci. 2005 Aug;22(3):541-51. doi: 10.1111/j.1460-9568.2005.04243.x. Eur J Neurosci. 2005. PMID: 16101736 - Retinoic acid influences neuronal migration from the ganglionic eminence to the cerebral cortex.
Crandall JE, Goodman T, McCarthy DM, Duester G, Bhide PG, Dräger UC, McCaffery P. Crandall JE, et al. J Neurochem. 2011 Nov;119(4):723-35. doi: 10.1111/j.1471-4159.2011.07471.x. Epub 2011 Oct 11. J Neurochem. 2011. PMID: 21895658 Free PMC article. - Neuronal migration in the developing cerebral cortex: observations based on real-time imaging.
Nadarajah B, Alifragis P, Wong RO, Parnavelas JG. Nadarajah B, et al. Cereb Cortex. 2003 Jun;13(6):607-11. doi: 10.1093/cercor/13.6.607. Cereb Cortex. 2003. PMID: 12764035 Review. - Cortical interneurons and their origins.
Wonders C, Anderson SA. Wonders C, et al. Neuroscientist. 2005 Jun;11(3):199-205. doi: 10.1177/1073858404270968. Neuroscientist. 2005. PMID: 15911869 Review.
Cited by
- Drug-induced activation of dopamine D(1) receptor signaling and inhibition of class I/II histone deacetylase induce chromatin remodeling in reward circuitry and modulate cocaine-related behaviors.
Schroeder FA, Penta KL, Matevossian A, Jones SR, Konradi C, Tapper AR, Akbarian S. Schroeder FA, et al. Neuropsychopharmacology. 2008 Nov;33(12):2981-92. doi: 10.1038/npp.2008.15. Epub 2008 Feb 20. Neuropsychopharmacology. 2008. PMID: 18288092 Free PMC article. - Prenatal exposure to drugs: effects on brain development and implications for policy and education.
Thompson BL, Levitt P, Stanwood GD. Thompson BL, et al. Nat Rev Neurosci. 2009 Apr;10(4):303-12. doi: 10.1038/nrn2598. Epub 2009 Mar 11. Nat Rev Neurosci. 2009. PMID: 19277053 Free PMC article. Review. - Caffeine Consumption During Pregnancy Accelerates the Development of Cognitive Deficits in Offspring in a Model of Tauopathy.
Zappettini S, Faivre E, Ghestem A, Carrier S, Buée L, Blum D, Esclapez M, Bernard C. Zappettini S, et al. Front Cell Neurosci. 2019 Oct 1;13:438. doi: 10.3389/fncel.2019.00438. eCollection 2019. Front Cell Neurosci. 2019. PMID: 31680863 Free PMC article. - Neuroimaging of children following prenatal drug exposure.
Derauf C, Kekatpure M, Neyzi N, Lester B, Kosofsky B. Derauf C, et al. Semin Cell Dev Biol. 2009 Jun;20(4):441-54. doi: 10.1016/j.semcdb.2009.03.001. Epub 2009 Mar 13. Semin Cell Dev Biol. 2009. PMID: 19560049 Free PMC article. Review. - Analysis and study of the mechanism of narcotic addiction and withdrawal.
Wang Y, Ke J, Li S, Kong Q, Zhang M, Li M, Gu J, Chi M. Wang Y, et al. Heliyon. 2024 Feb 27;10(5):e26957. doi: 10.1016/j.heliyon.2024.e26957. eCollection 2024 Mar 15. Heliyon. 2024. PMID: 38449641 Free PMC article.
References
- Akbari HM, Kramer HK, Whitaker-Azmitia PM, Spear LP, Azmitia EC. Prenatal cocaine exposure disrupts the development of the serotonergic system. Brain Res. 1992;572:57–63. - PubMed
- Anderson SA, Eisenstat DD, Shi L, Rubenstein JLR. Interneuron migration from basal forebrain to neocortex: sependence on Dlx genes. Science. 1997;278:474–476. - PubMed
- Anderson SA, Mione MC, Yun K, Rubenstein JLR. Differential origins of neocortical projection and local circuit neurons: role of Dlx genes in neocortical interneuronogenesis. Cereb Cortex. 1999;9:646–654. - PubMed
- Anderson SA, Marin O, Horn C, Jennings K, Rubenstein JL. Distinct cortical migrations from the medial and lateral ganglionic eminences. Development. 2001;128:353–363. - PubMed
- Anderson-Brown T, Slotkin TA, Seidler FJ. Cocaine acutely inhibits DNA synthesis in developing rat brain regions: evidence for direct actions. Brain Res. 1990;537:197–202. - PubMed
Publication types
MeSH terms
Substances
Grants and funding
- DA 00354/DA/NIDA NIH HHS/United States
- P01 HD005515/HD/NICHD NIH HHS/United States
- R29 DA008648/DA/NIDA NIH HHS/United States
- K02 DA000354/DA/NIDA NIH HHS/United States
- DA 08648/DA/NIDA NIH HHS/United States
- HD 05515/HD/NICHD NIH HHS/United States
- R01 NS043426/NS/NINDS NIH HHS/United States
- R01 MH057748/MH/NIMH NIH HHS/United States
- R01 DA008648/DA/NIDA NIH HHS/United States
- NS 43426/NS/NINDS NIH HHS/United States
- MH57748/MH/NIMH NIH HHS/United States
LinkOut - more resources
Full Text Sources
Other Literature Sources
