Prediction of Saccharomyces cerevisiae replication origins - PubMed (original) (raw)
Comparative Study
Prediction of Saccharomyces cerevisiae replication origins
Adam M Breier et al. Genome Biol. 2004.
Abstract
Background: Autonomously replicating sequences (ARSs) function as replication origins in Saccharomyces cerevisiae. ARSs contain the 17 bp ARS consensus sequence (ACS), which binds the origin recognition complex. The yeast genome contains more than 10,000 ACS matches, but there are only a few hundred origins, and little flanking sequence similarity has been found. Thus, identification of origins by sequence alone has not been possible.
Results: We developed an algorithm, Oriscan, to predict yeast origins using similarity to 26 characterized origins. Oriscan used 268 bp of sequence, including the T-rich ACS and a 3' A-rich region. The predictions identified the exact location of the ACS. A total of 84 of the top 100 Oriscan predictions, and 56% of the top 350, matched known ARSs or replication protein binding sites. The true accuracy was even higher because we tested 25 discrepancies, and 15 were in fact ARSs. Thus, 94% of the top 100 predictions and an estimated 70% of the top 350 were correct. We compared the predictions to corresponding sequences in related Saccharomyces species and found that the ACSs of experimentally supported predictions show significant conservation.
Conclusions: The high accuracy of the predictions indicates that we have defined near-sufficient conditions for ARS activity, the A-rich region is a recognizable feature of ARS elements with a probable role in replication initiation, and nucleotide sequence is a reliable predictor of yeast origins. Oriscan detected most origins in the genome, demonstrating previously unrecognized generality in yeast replication origins and significant discriminatory power in the algorithm.
Figures
Figure 1
Yeast replication origin profile and information content. In both panels, solid vertical lines at coordinates -108 and +159 indicate the 268 nucleotide region used by Oriscan. (a) Yeast origins were aligned by ACS with no gaps. The frequency of each base in the ACS T-rich strand in a 9 nucleotide window is plotted by distance from the ACS center. The ACS is visible as the high central peak in T frequency; the nearby A-rich region is enclosed in dashed vertical lines. Solid vertical lines enclose the region used in the Oriscan algorithm. (b) Information content in bits is shown for each position of the aligned origins. The ACS appears as the high central peak. The A-rich region to the right also shows elevated information content. The red line indicates the average information content for an alignment of randomly chosen sequences. Between (a) and (b), the positions of A and B elements in ARS1 [48] are shown for reference.
Figure 2
Refinement of Oriscan predictions. The number of matching (green) and total (black) predictions at different stages in the algorithm are shown. From the 12 million positions in the yeast genome, the best 11,800 matches to the core ACS were selected, and these matched 354 members of the ORC/MCM evaluation set (ACS). Selection against poly-T sequences removed 5,268 predictions, leaving 6,532, including 332 matches to the ORC/MCM set (non-T). Further selection using the 268 nucleotide matrix containing flanking sequence removed 4,632 predictions, leaving 1,900, including 257 matches (flanking). These predictions were then ranked; the top 350 contained 179 matches, and the top 100 contained 84 matches.
Figure 3
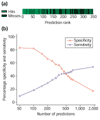
Specificity and sensitivity of ranked predictions. The training set was removed from consideration before generation of this figure. (a) Prediction accuracy is depicted visually as a function of rank. Each prediction was plotted in rank order and coded green if it matched a member of the evaluation set of probable origins or black if it did not, and plotted in rank order from left to right. The high concentration of matches in the top predictions is visible as large blocks of green on the left. (b) Specificity, defined as 100% minus the false positive rate, and sensitivity, 100% minus the false negative rate, are plotted for ranked groups of predictions in cumulative increments of 50 for the first 700 predictions and then for the total ranked list of 1,900 predictions. The ORC/MCM set was used for evaluation. Sensitivity gradually increases, and specificity decreases, as predictions of lower rank are included.
Figure 4
Predictions and ARS assay results compared to probable origin locations. (a) Shown are predictions in the top 100 that did not match the evaluation set along with their ARS activities. Likely origins in the evaluation set are in blue (ORC/MCM), and Oriscan predictions are in black. The width of the bars is not to scale. Vertical gray lines drawn through predictions show whether there is overlap with an evaluation set member. ARS assay results are scored on a scale of 0 to 3 for origin strength; 0 indicates inactivity, 1 indicates weak activity, and 2 and 3 indicate increasingly strong activity. Chromosomes are identified in Roman numerals at the top left of each plot, and positions in kb are given beneath the axis. Each prediction assayed is given a lowercase letter in red for reference in the text. For legibility, ARS assay results are offset for the pair of closely spaced predictions on chromosome IX. (b) All predictions and ARS assay results on chromosome XV. Plotting conventions are as in (a), except that origins which were tested after mutation of the ACS (f, j, and m) have a number indicating the ARS activity of the mutant in red under the original number. There are two very closely spaced predictions at 715 kb (g); neither was active, and this is denoted with a single 0.
Figure 5
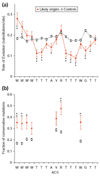
Conservation of the ACS across species. (a) The rate of evolution was calculated for the ACSs of 75 experimentally supported predictions and known origins (red solid diamonds, solid lines) using alignments to sequence of four other yeasts (see text). As a control, we performed the same analysis on 1,580 alignments of ACSs that passed the non-T step of Oriscan but did not match an ORC/MCM or known origin locus (black open squares, dashed lines). Substitutions per site were estimated by maximum parsimony, and error bars indicate the standard error of a Poisson distribution. Statistical significance is indicated by asterisks (* indicates p < 0.02; ** indicates p < 0.001). (b) The fraction of mutations that were conservative, that is, between the two allowed bases at a degenerate position, was calculated for each degenerate nucleotide of the ACS using the same probable active and control ACS alignments as in (a). Symbols and asterisks are as in (a).
Figure 6
Augmented sequence profile of known and predicted yeast replication origins. The 26-member training set and 208 experimentally supported predictions were combined, and their nucleotide frequencies were moving-averaged in a 3 nucleotide window. We used a 3 nucleotide window because it was the minimum needed to produce a relatively smooth plot. Shown is the 268 nucleotide region analyzed by Oriscan; the positions of A and B elements in ARS1 [48] are indicated below the horizontal axis. A peak in the frequency of T residues between the ACS and the A-rich region corresponding to the WTTT consensus within the B1 element is indicated by an asterisk, and a T-rich region is noted 5' to the ACS.
Similar articles
- Genome-wide mapping of ORC and Mcm2p binding sites on tiling arrays and identification of essential ARS consensus sequences in S. cerevisiae.
Xu W, Aparicio JG, Aparicio OM, Tavaré S. Xu W, et al. BMC Genomics. 2006 Oct 26;7:276. doi: 10.1186/1471-2164-7-276. BMC Genomics. 2006. PMID: 17067396 Free PMC article. - Origin replication complex binding, nucleosome depletion patterns, and a primary sequence motif can predict origins of replication in a genome with epigenetic centromeres.
Tsai HJ, Baller JA, Liachko I, Koren A, Burrack LS, Hickman MA, Thevandavakkam MA, Rusche LN, Berman J. Tsai HJ, et al. mBio. 2014 Sep 2;5(5):e01703-14. doi: 10.1128/mBio.01703-14. mBio. 2014. PMID: 25182328 Free PMC article. - Activation of silent replication origins at autonomously replicating sequence elements near the HML locus in budding yeast.
Vujcic M, Miller CA, Kowalski D. Vujcic M, et al. Mol Cell Biol. 1999 Sep;19(9):6098-109. doi: 10.1128/MCB.19.9.6098. Mol Cell Biol. 1999. PMID: 10454557 Free PMC article. - Structure, replication efficiency and fragility of yeast ARS elements.
Dhar MK, Sehgal S, Kaul S. Dhar MK, et al. Res Microbiol. 2012 May;163(4):243-53. doi: 10.1016/j.resmic.2012.03.003. Epub 2012 Mar 28. Res Microbiol. 2012. PMID: 22504206 Review. - The dual role of autonomously replicating sequences as origins of replication and as silencers.
Rehman MA, Yankulov K. Rehman MA, et al. Curr Genet. 2009 Aug;55(4):357-63. doi: 10.1007/s00294-009-0265-7. Epub 2009 Jul 26. Curr Genet. 2009. PMID: 19633981 Review.
Cited by
- Identification of 1600 replication origins in S. cerevisiae.
Foss EJ, Lichauco C, Gatbonton-Schwager T, Gonske SJ, Lofts B, Lao U, Bedalov A. Foss EJ, et al. Elife. 2024 Feb 5;12:RP88087. doi: 10.7554/eLife.88087. Elife. 2024. PMID: 38315095 Free PMC article. - Where and when to start: Regulating DNA replication origin activity in eukaryotic genomes.
Lee CSK, Weiβ M, Hamperl S. Lee CSK, et al. Nucleus. 2023 Dec;14(1):2229642. doi: 10.1080/19491034.2023.2229642. Nucleus. 2023. PMID: 37469113 Free PMC article. Review. - The conserved histone chaperone Spt6 is strongly required for DNA replication and genome stability.
Miller CLW, Winston F. Miller CLW, et al. Cell Rep. 2023 Mar 28;42(3):112264. doi: 10.1016/j.celrep.2023.112264. Epub 2023 Mar 15. Cell Rep. 2023. PMID: 36924499 Free PMC article. - Detection and characterization of constitutive replication origins defined by DNA polymerase epsilon.
Jaksik R, Wheeler DA, Kimmel M. Jaksik R, et al. BMC Biol. 2023 Feb 24;21(1):41. doi: 10.1186/s12915-023-01527-z. BMC Biol. 2023. PMID: 36829160 Free PMC article. - The extrachromosomal circular DNAs of the rice blast pathogen Magnaporthe oryzae contain a wide variety of LTR retrotransposons, genes, and effectors.
Joubert PM, Krasileva KV. Joubert PM, et al. BMC Biol. 2022 Nov 23;20(1):260. doi: 10.1186/s12915-022-01457-2. BMC Biol. 2022. PMID: 36424609 Free PMC article.
References
- Jacob F, Brenner S, Cuzin F. On the regulation of DNA replication in bacteria. Cold Spring Harb Symp Quant Biol. 1963;28:329–438.
- Newlon CS, Collins I, Dershowitz A, Deshpande AM, Greenfeder SA, Ong LY, Theis JF. Analysis of replication origin function on chromosome III of Saccharomyces cerevisiae. Cold Spring Harb Symp Quant Biol. 1993;58:415–423. - PubMed
- Stinchcomb DT, Struhl K, Davis RW. Isolation and characterisation of a yeast chromosomal replicator. Nature. 1979;282:39–43. - PubMed
- Brewer BJ, Fangman WL. The localization of replication origins on ARS plasmids in S. cerevisiae. Cell. 1987;51:463–471. - PubMed
- Huberman JA, Spotila LD, Nawotka KA, el-Assouli SM, Davis LR. The in vivo replication origin of the yeast 2 microns plasmid. Cell. 1987;51:473–481. - PubMed
Publication types
MeSH terms
Substances
LinkOut - more resources
Full Text Sources
Molecular Biology Databases


