Enhanced translation of a chloroplast-expressed RbcS gene restores small subunit levels and photosynthesis in nuclear RbcS antisense plants - PubMed (original) (raw)
Enhanced translation of a chloroplast-expressed RbcS gene restores small subunit levels and photosynthesis in nuclear RbcS antisense plants
Amit Dhingra et al. Proc Natl Acad Sci U S A. 2004.
Abstract
Ribulose-1,5-bisphosphate carboxylase/oxygenase (Rubisco) is a key enzyme that converts atmospheric carbon to food and supports life on this planet. Its low catalytic activity and specificity for oxygen leads to photorespiration, severely limiting photosynthesis and crop productivity. Consequently, Rubisco is a primary target for genetic engineering. Separate localization of the genes in the nuclear and chloroplast genomes and a complex assembly process resulting in a very low catalytic activity of hybrid Rubisco enzymes have rendered several earlier attempts of Rubisco engineering unsuccessful. Here we demonstrate that the RbcS gene, when integrated at a transcriptionally active spacer region of the chloroplast genome, in a nuclear RbcS antisense line and expressed under the regulation of heterologous (gene 10) or native (psbA) UTRs, results in the assembly of a functional holoenzyme and normal plant growth under ambient CO(2) conditions, fully shortcircuiting nuclear control of gene regulation. There was approximately 150-fold more RbcS transcript in chloroplast transgenic lines when compared with the nuclear RbcS antisense line, whereas the wild type has 7-fold more transcript. The small subunit protein levels in the gene 10/RbcS and psbA/RbcS plants were 60% and 106%, respectively, of the wild type. Photosynthesis of gene 10/RbcS plants was approximately double that of the antisense plants, whereas that of psbA/RbcS plants was restored almost completely to the wild-type rates. These results have opened an avenue for using chloroplast engineering for the evaluation of foreign Rubisco genes in planta that eventually can result in achieving efficient photosynthesis and increased crop productivity.
Figures
Fig. 1.
(A) Schematic representation of the 16S-23S region of wild-type tobacco chloroplast genome. The _Bam_HI/_Bgl_II restriction fragment, P1, was used as a probe to investigate homoplasmy. The _Apa_I restriction fragment, P2, was used as a probe to detect 16S rRNA transcript levels in Northern analysis. Also shown are transgenic chloroplast genomes harboring pLDADg10_Rbc_S(B) or pLDAD_psb_A_Rbc_S (C) as well as the annealing positions of primers 3P/3M and 5P/2M and expected amplicon sizes. (D) PCR analysis with primer pair 3P/3M. Lane M, 1-kb DNA ladder; lanes 1 and 2, untransformed; lanes 3 and 4, Nt-pLDADg10_Rbc_S; lanes 5 and 6, Nt-LDAD_psb_A_Rbc_S. (E) PCR analysis with primer pair 5P/2M. Lane M, 1-kb DNA ladder; lanes 1 and 2, untransformed; lanes 3 and 4, Nt-pLDADg10_Rbc_S; lanes 5 and 6, Nt-pLDAD_psb_A_Rbc_S. (F) Southern blot analysis. Total DNA was digested with _Sma_I and probed with a radiolabeled _Bgl_II/_Bam_HI fragment, P1. WT, untransformed; lanes 1 and 2, Nt-pLDADg10_Rbc_S; lanes 3 and 4, Nt-pLDAD_psb_A_Rbc_S. (G) Southern blot analysis. Total DNA was probed with _Rbc_S. Nt-pLDADg10_Rbc_S was digested with _Xba_I (lanes 1 and 2) and Nt-pLDAD_psb_A_Rbc_S was probed with _Spe_I (lanes 3 and 4).
Fig. 2.
Analysis of transcript levels under normal photoperiod (0D) or continuous light for 1, 3, and 5 days. (A) Nt-pLDADg10_Rbc_S. (B) Densitometry analysis of the Northern blot shown in A. (C) Nt-pLDAD_psb_A_Rbc_S. (D) Densitometry analysis of the Northern blot shown in C. Lanes 1–3 represent the Northern blot exposed for different durations. Cy-_Rbc_S, cytosolic _Rbc_S mRNA (900 nt), plastid (Pl) 16S rRNA (1,490 nt) was used as a control for equal loading (lane 4). (E) Relative _Rbc_S transcript levels in wild-type and _Rbc_S antisense plant (α5). An equal amount of RNA (5 μg) was loaded per sample.
Fig. 3.
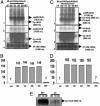
Qualitative comparison of SSU protein levels in 100 mg (fresh weight) of leaf tissue and an equal volume (10 μl of each) examined on a 14% SDS/PAGE gel. (A and C, Upper) Immunoblot probed with anti-Rubisco antibody. (A and C, Lower) GelCode blue-stained SDS/PAGE gel. Numbers below the stained gel indicate the amount of protein loaded (in μg). Shown are Nt-pLDADg10_Rbc_S (A) or Nt-pLDAD_psb_A_Rbc_S (C) grown under normal photoperiod (0D) or under continuous light for 1, 3, and 5 days. (B and D) Densitometry analysis of the immunoblots shown in A and C, respectively.
Fig. 4.
Quantitative comparison of SSU protein level in 10 μg of total protein examined on a 14% SDS/PAGE gel. (A and C, Upper) Immunoblot probed with anti-Rubisco antibody. (A and C, Lower) GelCode blue-stained SDS/PAGE gel. Shown are the Nt-pLDADg10_Rbc_S line (A) or Nt-pLDAD_psb_A_Rbc_S (C) grown under normal photoperiod (0D) or exposed to continuous light for 1, 3, and 5 days. (B and D) Densitometry analysis of the immunoblots shown in A and C, respectively.
Fig. 5.
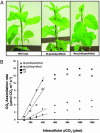
(A) Comparative growth of wild-type, Nt-pLDADg10_Rbc_S, and Nt-pLDAD_psb_A_Rbc_S plants 29 days after transfer to soil in pots. (B) Photosynthetic CO2 assimilation rates under 21% O2. The calculated (dotted lines) initial slopes of CO2 assimilation (μmol CO2 m-2 s-1 μbar-1) were: α5, 0.0051; Nt-pLDADg10_Rbc_S, 0.0096; Nt-pLDAD_psb_A_Rbc_S, 0.0271; and wild type, 0.0336. These data were determined from linear regressions of the data from 100–400 μbar CO2.
Similar articles
- Complementation of the nuclear antisense rbcS-induced photosynthesis deficiency by introducing an rbcS gene into the tobacco plastid genome.
Zhang XH, Ewy RG, Widholm JM, Portis AR Jr. Zhang XH, et al. Plant Cell Physiol. 2002 Nov;43(11):1302-13. doi: 10.1093/pcp/pcf158. Plant Cell Physiol. 2002. PMID: 12461130 - Availability of Rubisco small subunit up-regulates the transcript levels of large subunit for stoichiometric assembly of its holoenzyme in rice.
Suzuki Y, Makino A. Suzuki Y, et al. Plant Physiol. 2012 Sep;160(1):533-40. doi: 10.1104/pp.112.201459. Epub 2012 Jul 17. Plant Physiol. 2012. PMID: 22811433 Free PMC article. - Ribulose 1,5-bisphosphate carboxylase/oxygenase large subunit translation is regulated in a small subunit-independent manner in the expanded leaves of tobacco.
Ichikawa K, Miyake C, Iwano M, Sekine M, Shinmyo A, Kato K. Ichikawa K, et al. Plant Cell Physiol. 2008 Feb;49(2):214-25. doi: 10.1093/pcp/pcm179. Epub 2008 Jan 4. Plant Cell Physiol. 2008. PMID: 18178584 - Manipulating ribulose bisphosphate carboxylase/oxygenase in the chloroplasts of higher plants.
John Andrews T, Whitney SM. John Andrews T, et al. Arch Biochem Biophys. 2003 Jun 15;414(2):159-69. doi: 10.1016/s0003-9861(03)00100-0. Arch Biochem Biophys. 2003. PMID: 12781767 Review. - Improving photosynthesis through the enhancement of Rubisco carboxylation capacity.
Iñiguez C, Aguiló-Nicolau P, Galmés J. Iñiguez C, et al. Biochem Soc Trans. 2021 Nov 1;49(5):2007-2019. doi: 10.1042/BST20201056. Biochem Soc Trans. 2021. PMID: 34623388 Review.
Cited by
- The role of heterologous chloroplast sequence elements in transgene integration and expression.
Ruhlman T, Verma D, Samson N, Daniell H. Ruhlman T, et al. Plant Physiol. 2010 Apr;152(4):2088-104. doi: 10.1104/pp.109.152017. Epub 2010 Feb 3. Plant Physiol. 2010. PMID: 20130101 Free PMC article. - Cloning and characterization of ribulose-1,5-bisphosphate carboxylase/oxygenase small subunit (RbcS) cDNA from green microalga Ankistrodesmus convolutus.
Thanh T, Chi VT, Abdullah MP, Omar H, Noroozi M, Napis S. Thanh T, et al. Mol Biol Rep. 2011 Nov;38(8):5297-305. doi: 10.1007/s11033-011-0679-4. Epub 2011 Feb 2. Mol Biol Rep. 2011. PMID: 21287365 - The chloroplast genome of Salix floderusii and characterization of chloroplast regulatory elements.
Ren W, Jiang Z, Zhang M, Kong L, Zhang H, Liu Y, Fu Q, Ma W. Ren W, et al. Front Plant Sci. 2022 Aug 26;13:987443. doi: 10.3389/fpls.2022.987443. eCollection 2022. Front Plant Sci. 2022. PMID: 36092427 Free PMC article. - Advancing organelle genome transformation and editing for crop improvement.
Li S, Chang L, Zhang J. Li S, et al. Plant Commun. 2021 Jan 4;2(2):100141. doi: 10.1016/j.xplc.2021.100141. eCollection 2021 Mar 8. Plant Commun. 2021. PMID: 33898977 Free PMC article. Review. - Complete chloroplast genome sequence of Gycine max and comparative analyses with other legume genomes.
Saski C, Lee SB, Daniell H, Wood TC, Tomkins J, Kim HG, Jansen RK. Saski C, et al. Plant Mol Biol. 2005 Sep;59(2):309-22. doi: 10.1007/s11103-005-8882-0. Plant Mol Biol. 2005. PMID: 16247559
References
- Ogren, W. L. (2003) Photosynth. Res. 76, 53-63. - PubMed
- Spreitzer, R. J. & Salvucci, M. E. (2002) Annu. Rev. Plant Biol. 53, 449-475. - PubMed
- Houtz, R. L. & Portis, A. R. (2003) Arch. Biochem. Biophys. 414, 150-158. - PubMed
- Madgwick, P. J., Colliver, S. P., Banks, F. M., Habash, D. Z., Dulieu, H., Parry, M. A. J. & Paul, M. J. (2002) Ann. Appl. Biol. 140, 13-19.
Publication types
MeSH terms
Substances
LinkOut - more resources
Full Text Sources
Other Literature Sources


