Factors that make an infectious disease outbreak controllable - PubMed (original) (raw)
Factors that make an infectious disease outbreak controllable
Christophe Fraser et al. Proc Natl Acad Sci U S A. 2004.
Abstract
The aim of this study is to identify general properties of emerging infectious agents that determine the likely success of two simple public health measures in controlling outbreaks, namely (i) isolating symptomatic individuals and (ii) tracing and quarantining their contacts. Because these measures depend on the recognition of specific disease symptoms, we investigate the relative timing of infectiousness and the appearance of symptoms by using a mathematical model. We show that the success of these control measures is determined as much by the proportion of transmission occurring prior to the onset of overt clinical symptoms (or via asymptomatic infection) as the inherent transmissibility of the etiological agent (measured by the reproductive number R(0)). From published studies, we estimate these quantities for two moderately transmissible viruses, severe acute respiratory syndrome coronavirus and HIV, and for two highly transmissible viruses, smallpox and pandemic influenza. We conclude that severe acute respiratory syndrome and smallpox are easier to control using these simple public health measures. Direct estimation of the proportion of asymptomatic and presymptomatic infections is achievable by contact tracing and should be a priority during an outbreak of a novel infectious agent.
Figures
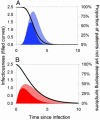
Fig. 1.
Key epidemiological determinants. These determinants describe the pattern of typical disease progression for an individual patient as a function of time since infection (measured in arbitrary units). Filled curves represent infectiousness through time (left axis). The black curve represents S(τ), the probability of a person not having developed symptoms by a certain time (right axis). The basic reproduction number _R_0 is the area under the infectiousness curve (solid color plus cross-hatched section). The solid-colored area represents transmission arising prior to symptoms such that θ, the proportion of presymptomatic transmission, is the proportion of the total area under the infectiousness curve that is solid-colored. (A and B) Low- and high-variance incubation and infectiousness distributions, respectively. Both cases have _R_0 = 5, _T_g = 3 (in arbitrary time units), andθ = 0.5; A shows a low variance of 0.1 × mean2, whereas B shows a high variance of 0.5 × mean2.
Fig. 2.
Parameter estimates. Plausible ranges for the key parameters _R_0 and θ (see main text for sources) for four viral infections of public concern are shown as shaded regions. The size of the shaded area reflects the uncertainties in the parameter estimates. The areas are color-coded to match the assumed variance values for β(τ) and S(τ) of Fig. 1 appropriate for each disease, for reasons that are apparent in Fig. 3.
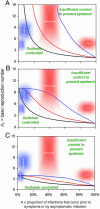
Fig. 3.
Criteria for outbreak control. Each curve represents a different scenario, consisting of a combination of interventions and a choice of parameters. For each scenario, if a given infectious agent is below the _R_0–θ curve, the outbreak is always controlled eventually. Above the curve, additional control measures (e.g., movement restrictions) would be required to control spread. Black lines correspond to isolating symptomatic individuals only. Colored lines correspond to the addition of immediate tracing and quarantining of all contacts of isolated symptomatic individuals. The black (isolation only) line is independent of distributional assumptions made (low or high variance), whereas the colored (isolation + contact tracing) lines match the variance assumptions made in Fig. 1 (red = high variance; blue = low variance). The efficacy of isolation of symptomatic individuals is 100% in A, 90% in B, and 75% in C. Contact tracing and isolation is always assumed 100% effective in the scenarios in which it is implemented (colored lines). Curves are calculated by using a mathematical model of outbreak spread incorporating quarantining and contact tracing (see main text).
Similar articles
- Comparing nonpharmaceutical interventions for containing emerging epidemics.
Peak CM, Childs LM, Grad YH, Buckee CO. Peak CM, et al. Proc Natl Acad Sci U S A. 2017 Apr 11;114(15):4023-4028. doi: 10.1073/pnas.1616438114. Epub 2017 Mar 28. Proc Natl Acad Sci U S A. 2017. PMID: 28351976 Free PMC article. - Digital contact tracing technologies in epidemics: a rapid review.
Anglemyer A, Moore TH, Parker L, Chambers T, Grady A, Chiu K, Parry M, Wilczynska M, Flemyng E, Bero L. Anglemyer A, et al. Cochrane Database Syst Rev. 2020 Aug 18;8(8):CD013699. doi: 10.1002/14651858.CD013699. Cochrane Database Syst Rev. 2020. PMID: 33502000 Free PMC article. - The effectiveness of contact tracing in emerging epidemics.
Klinkenberg D, Fraser C, Heesterbeek H. Klinkenberg D, et al. PLoS One. 2006 Dec 20;1(1):e12. doi: 10.1371/journal.pone.0000012. PLoS One. 2006. PMID: 17183638 Free PMC article. - Heterogeneity in transmissibility and shedding SARS-CoV-2 via droplets and aerosols.
Chen PZ, Bobrovitz N, Premji Z, Koopmans M, Fisman DN, Gu FX. Chen PZ, et al. Elife. 2021 Apr 16;10:e65774. doi: 10.7554/eLife.65774. Elife. 2021. PMID: 33861198 Free PMC article. - Prevention and control of emerging infections: a challenge for the 3rd millennium.
Rezza G. Rezza G. New Microbiol. 2007 Jul;30(3):358-61. New Microbiol. 2007. PMID: 17802926 Review.
Cited by
- Implications of the school-household network structure on SARS-CoV-2 transmission under school reopening strategies in England.
Munday JD, Sherratt K, Meakin S, Endo A, Pearson CAB, Hellewell J, Abbott S, Bosse NI; CMMID COVID-19 Working Group; Atkins KE, Wallinga J, Edmunds WJ, van Hoek AJ, Funk S. Munday JD, et al. Nat Commun. 2021 Mar 29;12(1):1942. doi: 10.1038/s41467-021-22213-0. Nat Commun. 2021. PMID: 33782396 Free PMC article. - Effect of asymptomatic transmission and emergence time on multi-strain viral disease severity.
Alizad-Rahvar AR, Sadeghi M. Alizad-Rahvar AR, et al. PLoS One. 2022 Oct 7;17(10):e0269464. doi: 10.1371/journal.pone.0269464. eCollection 2022. PLoS One. 2022. PMID: 36206212 Free PMC article. - Suppressing the impact of the COVID-19 pandemic using controlled testing and isolation.
Cohen K, Leshem A. Cohen K, et al. Sci Rep. 2021 Mar 18;11(1):6279. doi: 10.1038/s41598-021-85458-1. Sci Rep. 2021. PMID: 33737580 Free PMC article. - Trends in parameterization, economics and host behaviour in influenza pandemic modelling: a review and reporting protocol.
Carrasco LR, Jit M, Chen MI, Lee VJ, Milne GJ, Cook AR. Carrasco LR, et al. Emerg Themes Epidemiol. 2013 May 7;10(1):3. doi: 10.1186/1742-7622-10-3. Emerg Themes Epidemiol. 2013. PMID: 23651557 Free PMC article. - Transmission dynamics and risk factors for pandemic H1N1-related illness: outbreak investigation in a rural community of British Columbia, Canada.
Janjua NZ, Skowronski DM, Hottes TS, Osei W, Adams E, Petric M, Lem M, Tang P, De Serres G, Patrick DM, Bowering D. Janjua NZ, et al. Influenza Other Respir Viruses. 2012 May;6(3):e54-62. doi: 10.1111/j.1750-2659.2012.00344.x. Epub 2012 Mar 2. Influenza Other Respir Viruses. 2012. PMID: 22385647 Free PMC article.
References
- Riley, S., Fraser, C., Donnelly, C. A., Ghani, A. C., Abu-Raddad, L. J., Hedley, A. J., Leung, G. M., Ho, L. M., Lam, T. H., Thach, T. Q., et al. (2003) Science 300, 1961-1966. - PubMed
MeSH terms
LinkOut - more resources
Full Text Sources
Other Literature Sources


