Analysis of heterogeneous interactions - PubMed (original) (raw)
Analysis of heterogeneous interactions
James L Cole. Methods Enzymol. 2004.
No abstract available
Figures
Figure 1
Schematic illustraiton of specific and nonspecific hetero-interactions. A) Discrete binding with A+2B → AB2 model. B) Nonspecific binding of a large ligand to a finite, one-dimensional lattice. One of the 6 possible configurations for binding of two ligands of length 4 to a linear lattice of length 10. The open circles represent lattice sites. C) Overlapping ligand model for the nonspecific binding of two ligands of length 4 to a helical lattice of length 10 with a minimal offset of 2. The leftmost binding site on the ligand must contact a lattice site indicated by an open circle. Only one of the 15 possible configurations is shown.
Figure 2
Array designs used in global nonlinear least squares fitting of sedimentation equilibrium experiment. A) Design of the concatenated data arrays. Individual data sets are denoted A, B, C, with elements 0-k, 0-l, and 0-m, respectively. The index vector labels each point in the array with the source data file. B) Design of the parameter array for an A+2B → AB2 model with n data sets.
Figure 3
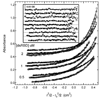
Multiwavelength sedimentation equilibrium of PKR dsRBD binding to 20 mer dsRNA. The data were obtained under the following conditions: rotor speed, 23,000 RPM; temperature, 20°C; RNA concentration, 0.5 µM and protein concentrations of 0.5 µM, 1 µM and 2 µM in 75 mM NaCl, 20 mM HEPES, 5 mM MgCl2, 0.1 mM EDTA, pH 7.5. Detection wavelengths are: 230 nm (o), 260 nm ( ) and 280 nm (△). Solid lines are a global fit of the data to an unconstrained model of three ligands binding to the 20 mer RNA. The results of the fit are given in table I. Inset: residuals. Traces have been vertically offset for clarity.
Figure 4
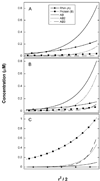
Species distribution from sedimentation equilibrium analysis of PKR dsRBD binding to 20 mer dsRNA. Best fit parameters from the unconstrained analysis in Table 2 were used to generate radial concentration gradients for all the species present in solution. Species are RNA ( ), protein (
 ), AB (
 ), AB2 (
 ), AB3 (
 ). A) [RNA] = 0.5 µM, [Protein] = 0.5 µM. B) [RNA] = 0.5 µM, [Protein] = 1 µM. C) [RNA] = 0.5 µM, [Protein] = 2 µM.
Similar articles
- NMR studies on protein-nucleic acid interaction.
Kaptein R. Kaptein R. J Biomol NMR. 2013 May;56(1):1-2. doi: 10.1007/s10858-013-9736-8. J Biomol NMR. 2013. PMID: 23657842 No abstract available. - Global analysis of non-specific protein-nucleic interactions by sedimentation equilibrium.
Ucci JW, Cole JL. Ucci JW, et al. Biophys Chem. 2004 Mar 1;108(1-3):127-40. doi: 10.1016/j.bpc.2003.10.033. Biophys Chem. 2004. PMID: 15043926 Free PMC article. - Protein-nucleic acid interactions.
Rhodes D, Burley SK. Rhodes D, et al. Curr Opin Struct Biol. 2000 Feb;10(1):75-7. doi: 10.1016/s0959-440x(99)00052-4. Curr Opin Struct Biol. 2000. PMID: 10766517 Review. No abstract available. - Calculating sedimentation coefficient distributions by direct modeling of sedimentation velocity concentration profiles.
Dam J, Schuck P. Dam J, et al. Methods Enzymol. 2004;384:185-212. doi: 10.1016/S0076-6879(04)84012-6. Methods Enzymol. 2004. PMID: 15081688 No abstract available. - Biophysical studies by ultracentrifugation.
Laue T. Laue T. Curr Opin Struct Biol. 2001 Oct;11(5):579-83. doi: 10.1016/s0959-440x(00)00250-5. Curr Opin Struct Biol. 2001. PMID: 11785759 Review.
Cited by
- Mechanistic and structural studies reveal NRAP-1-dependent coincident activation of NMDARs.
Goodell DJ, Whitby FG, Mellem JE, Lei N, Brockie PJ, Maricq AJ, Eckert DM, Hill CP, Madsen DM, Maricq AV. Goodell DJ, et al. Cell Rep. 2024 Feb 27;43(2):113694. doi: 10.1016/j.celrep.2024.113694. Epub 2024 Jan 23. Cell Rep. 2024. PMID: 38265937 Free PMC article. - The conjugative DNA translocase TrwB is a structure-specific DNA-binding protein.
Matilla I, Alfonso C, Rivas G, Bolt EL, de la Cruz F, Cabezon E. Matilla I, et al. J Biol Chem. 2010 Jun 4;285(23):17537-44. doi: 10.1074/jbc.M109.084137. Epub 2010 Apr 6. J Biol Chem. 2010. PMID: 20375020 Free PMC article. - The oligomeric state of the active Vps4 AAA ATPase.
Monroe N, Han H, Gonciarz MD, Eckert DM, Karren MA, Whitby FG, Sundquist WI, Hill CP. Monroe N, et al. J Mol Biol. 2014 Feb 6;426(3):510-25. doi: 10.1016/j.jmb.2013.09.043. Epub 2013 Oct 23. J Mol Biol. 2014. PMID: 24161953 Free PMC article. - The cytoplasmic N-terminal tail of Zika virus NS4A protein forms oligomers in the absence of detergent or lipids.
Surya W, Liu Y, Torres J. Surya W, et al. Sci Rep. 2023 May 5;13(1):7360. doi: 10.1038/s41598-023-34621-x. Sci Rep. 2023. PMID: 37147499 Free PMC article. - Structural basis of protein translocation by the Vps4-Vta1 AAA ATPase.
Monroe N, Han H, Shen PS, Sundquist WI, Hill CP. Monroe N, et al. Elife. 2017 Apr 5;6:e24487. doi: 10.7554/eLife.24487. Elife. 2017. PMID: 28379137 Free PMC article.
References
- von Mering C, Krause R, Snel B, Cornell M, Oliver SG, Fields S, Bork P. Nature. 2002;417:399–403. - PubMed
- Stafford WF. Methods Enzymol. 2003 This volume.
- Dam J, Schuck P. Methods Enzymol. 2003 This volume. - PubMed
- Minton AP. Prog. Colloid Polym. Sci. 1997;107:11–19.
- Edsall JT, Wyman J. Biophysical Chemistry. New York: Academic Press; 1958.
Publication types
MeSH terms
Substances
LinkOut - more resources
Full Text Sources
Other Literature Sources


