Insertion of the beta Geo promoter trap into the Fem1c gene of ROSA3 mice - PubMed (original) (raw)
Insertion of the beta Geo promoter trap into the Fem1c gene of ROSA3 mice
Cassandra L Schlamp et al. Mol Cell Biol. 2004 May.
Abstract
ROSA3 mice were developed by retroviral insertion of the beta Geo gene trap vector. Adult ROSA3 mice exhibit widespread expression of the trap gene in epithelial cells found in most organs. In the central nervous system the highest expression of beta Geo is found in CA1 pyramidal cells of the hippocampus, Purkinje cells of the cerebellum, and ganglion cells of the retina. Characterization of the genomic insertion site for beta Geo in ROSA3 mice shows that the trap vector is located in the first intron of Fem1c, a gene homologous to the sex-determining gene fem-1 of Caenorhabditis elegans. Transcription of the Rosa3 allele (R3) yields a spliced message that includes the first exon of Fem1c and the beta Geo coding region. Although normal processing of the Fem1c transcript is disrupted in homozygous Rosa3 (Fem1c(R3/R3)) mice, some tissues show low levels of a partially processed transcript containing exons 2 and 3. Since the entire coding region of Fem1c is located in these two exons, Fem1c(R3/R3) mice may still be able to express a putative FEM1C protein. To this extent, Fem1c(R3/R3) mice show no adverse effects in their sexual development or fertility or in the attenuation of neuronal cell death, another function that has been attributed to both fem-1 and a second mouse homolog, Fem1b. Examination of beta Geo expression in ganglion cells after exposure to damaging stimuli indicates that protein levels are rapidly depleted prior to cell death, making the beta Geo reporter gene a potentially useful marker to study early molecular events in damaged neurons.
Figures
FIG. 1.
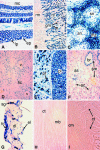
β-Galactosidase expression is widespread in the adult ROSA3 mouse. X-Gal staining was used to determine the βGeo expression patterns in frozen sections of various tissues harvested from adult R3/+ mice. Each panel is a micrograph taken at ×100 magnification. (A) Intestine. Epithelial cells (ep) lining the villi, which are seen mostly in cross section, are strongly and uniformly stained. No staining is detected in the lamina propria (lp), which form the cores of the villi, or in the circular and longitudinal muscles forming the muscular coat (mc) surrounding the intestine. (B) Kidney. Staining is present in the convoluted tubules of the renal cortex (rc) and absent from the renal medulla (rm). Glomeruli (gm) are less intensely stained. (C) Spleen. Staining is mostly restricted to cells in the marginal zone (mz) surrounding splenic nodules (sn). (D) Liver. Sparse staining is mainly detected in hepatocytes of the hepatic cords (hc). Vascular endothelial cells forming hepatic blood vessels (v) are unstained. (E) Thyroid. Intense staining is present in follicle cells of the pyramidal lobe (pl). In an adjacent lobe, follicular cells are lightly stained whereas presumptive parafollicular cells (pf) are intensely stained. (F) Lung. Intense staining is present in the columnar epithelium of the bronchioles (br) and in a population of (type II) alveolar cells (ac) lining alveoli and alveolar sacs (as). No staining is detected in smooth muscle (sm) surrounding the bronchioles and blood vessels (arrows). (G) Skin. Intense labeling is present in the sebaceous glands (sg) of each hair follicle. Some label is detected in the cells of the epidermal (el) and dermal layers (dl). Fat cells (fc) underlying the dermis also appear labeled. (H and I) Skeletal muscle (H) and cardiac muscle (I). No staining is detected in muscle cell bundles (mb) or cardiac muscle cells (cm). Cells comprising connective tissue (ct) appear to be lightly or negatively stained. Eosin was used for counterstaining.
FIG. 2.
Distinct neuronal cell populations express βGeo in the adult Rosa3 brain. Brains were harvested from adult R3/+ mice and processed as described for Fig. 1. (A) Hippocampus. Intense staining is present in the CA1 pyramidal neurons (pyr [arrow]), and light staining is present in the CA3 pyramidal cells. Light staining to no staining is visible in the CA2 neurons, the oriens layer (ol), and the stratum radiatum (sr). Only diffuse staining is present in the dentate gyrus. ml-D, molecular layer; gl-D, granular layer; pl-D, polymorphic layer. (B) Cerebral cortex. Variable staining is present in the cerebrum. The molecular layer (ml-C), which is comprised mainly of nerve fibers, is unstained. Although cortical layers II to VI (II-VI-C) are not clearly discernible, the majority of stained neurons are present in the external granular layer (egl). (C) Cerebellum. Purkinje cells are strongly stained (pc [arrow]), but only sparse staining is present in the granular layer (gl). Stellate cells (sc [arrow]) of the molecular layer (ml) are unstained. nf, nerve fibers. (D) Striatum. Some neurons making up the gray matter (gm) of the striatum are stained. nf, nerve fiber bundles. (E) Inferior colliculus. Staining is present in cells throughout the external cortex of the inferior colliculus (ec-IC) adjacent to the cerebellum. gl, granular layer; ml, molecular layer of the cerebellum. (F) Choroid plexus. Intense staining is evident in the epithelial cells of the choroid plexus (CP) forming the roof of the fourth ventricle. Stained cells are present throughout the vestibular nucleus of the medulla oblongata (vn-MO) region. Nuclear fast red was used for counterstaining. Bar (in panel D) for panels A to D, 75 μm. Bar (in panel F) for panels E and F, 125 μm.
FIG. 3.
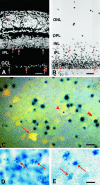
β-Galactosidase is primarily expressed in retinal ganglion cells and in a subset of cells in the inner nuclear layer. (A and B) Histological analysis of BluoGal-stained retinas from R3/+ mice. (A) Fluorescent image of a transverse section through a mouse retina (stained with DAPI to highlight nuclei); (B) bright-field image of the same section. BluoGal staining is localized around cells in the ganglion cell layer (GCL). Stain is also deposited in the inner plexiform layer (IPL), which contains the majority of ganglion cell dendritic processes. Some cells in the inner region of the inner nuclear layer (INL) are also labeled. Examples of labeled cells in both the GCL and INL are highlighted with arrows in both panels. No staining is evident in the photoreceptors of the outer nuclear layer (ONL). OPL, outer plexiform layer. Bar, 25 μm. (C) Photomicrograph (taken with both fluorescent and bright-field illumination) of a flat-mounted retina from a R3/+ mouse, showing colocalization of Fluorogold and βGeo activity (as revealed by X-Gal staining) in cells of the ganglion cell layer. Fluorogold labeled the cytoplasm, while X-Gal concentrated in the nucleus. Some ganglion cells have central nuclei (arrowhead), while most cells have nuclei positioned eccentrically (double arrowhead). In the ganglion cell layer, 91% ± 1% of Fluorogold-labeled cells (n = 584) express βGeo. Incomplete penetration of the X-Gal stain could account for the small percentage of Fluorogold-labeled cells that are not associated with βGeo expression (arrow); alternatively, these cells may represent a subset of retinal ganglion cells that do not express the transgene. Bar, 10 μm. (D and E) Bright-field images of whole-mounted retinas stained with BluoGal. The focal plane is centered on the inner nuclear layer of each retina, showing scattered labeled cells (arrows). The control retina has an extensive blue background due tolabeled ganglion cells (D). A retina taken from the contralateral eye of the same mouse 2 weeks after optic nerve crushing shows reduced staining of the ganglion cell layer but no change in labeling in the inner nuclear layer (E). Bar, 5 μm.
FIG. 4.
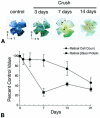
A decrease in βGeo protein levels precedes cell loss stimulated by optic nerve crushing. (A) BluoGal-stained retinal whole mounts harvested from mice at selected time points after optic nerve crushing (Crush). BluoGal staining progressively decreases with time after optic nerve crushing. T, temporal; N, nasal; S, superior. (B) Graph comparing the rate of cell loss in the ganglion cell layer (filled circles) to the rate of decrease in βGeo protein (filled squares) after optic nerve crushing. Cell loss was quantified from histological sections, and protein was quantified using a β-galactosidase ELISA. The decrease in βGeo protein levels precedes cell loss in the Rosa3 retina after optic nerve crushing, with similar kinetics displayed by other ganglion cell genes (26).
FIG. 5.
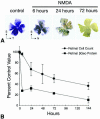
A decrease in βGeo protein levels precedes cell death stimulated by excitotoxins. (A) BluoGal-stained retinal whole mounts harvested from mice at selected time points after intravitreal injection of 160 nmol of the glutamate analog NMDA. BluoGal staining rapidly decreases in the ganglion cell layer after exposure to NMDA. T, temporal; N, nasal; S, superior. (B) Graph comparing the rate of cell loss in the ganglion cell layer (filled circles) to the rate of decrease in βGeo protein (filled squares) after NMDA injection. Cell loss was quantified from histological sections, and protein was quantified using a β-galactosidase ELISA. As seen under the conditions described for optic nerve crushing, the decrease in βGeo transgene expression precedes cell loss in the Rosa3 retina after exposure to NMDA. NMDA injection results in cell loss and reduced βGeo transgene expression more rapidly than optic nerve crushing, but the relationship between protein loss and cell loss is similar.
FIG. 6.
βGeo insertion disrupts normal Fem1c expression. (A) Map of Fem1c on chromosome 18 showing the insertion site of the βGeo trap vector. Exons of Fem1c are shown as filled boxes. The βGeo coding region is shown as a stippled box, and the flanking retroviral long terminal repeats are shown as open boxes. βGeo contains an internal EcoRI restriction site that was used for inverse PCR experiments. The relative positions of various primers (a to h) used for PCR experiments are shown with arrows. The sequences and names of these primers are detailed in Table 1. βGeo is inserted into the first intron of the Fem1c gene. (B) Ethidium bromide-stained agarose gels showing the results of RT-PCR analysis of transcripts from the Fem1c alleles. Total RNA was isolated from Rosa3 mouse brains and used to make first-strand cDNA. The genotypes of the mice are indicated above each lane. β-Actin amplification was used as a control for equivalent amounts of template cDNA (top panel). The results of RT-PCR with primers e and b (BF4.1 and LacZ.2, respectively) show that the βGeo coding region is spliced onto exon 1 of Fem1c only in R3/R3 and R3/+ mice (second panel from top). Sequence analysis of this fragment shows correct splicing at the end of exon 1. The results of RT-PCR with primers e and f (BF4.1 and BF4.2, respectively) indicate appropriate splicing of exons 1 and 2 (Ex 1 + 2) of Fem1c in mice that carry one or both wild-type alleles. No splice was evident in R3/R3 mice (third panel). The results of RT-PCR with primers g and h (BF4.6 and BF4.7, respectively) indicate appropriate splicing of exons 2 and 3 of Fem1c. No splice that bypasses exon 1 is detected in R3/R3 mouse brain under these PCR conditions (30 cycles) (fourth panel). These data show that Fem1c expression is knocked out in R3/R3 mice. Ex 2 + 3, exons 2 and 3. (C) Ethidium bromide-stained agarose gel of RT-PCR products generated from extended (40-cycle) PCR. All products were generated from testes RNA isolated from R3/R3 or wild-type mice. Samples from R3/R3 mice exhibit a faint band indicative of a transcript containing correctly spliced exons 2 and 3 of Fem1c. No transcript containing exons 1 and 2 of Fem1c in the same mice was detected. Primers used for these products were the same as those used as describe for panel B, and β-actin was used as a control.
FIG. 7.
Fem1c and R3 alleles exhibit similar patterns of expression. Ethidium bromide-stained agarose gels showing the results of RT-PCR for β-actin (control) and transcripts from the R3 (Fem1c/Rosa3) and Fem1c (exons 2 and 3 [Ex 2 + 3]) alleles in different tissues of R3/+ mice. Both alleles are expressed in brain, eye, and kidney but not in skeletal muscle (consistent with the X-Gal staining pattern shown in Fig. 1). The R3 allele is expressed in cardiac muscle, but only low levels of the Fem1c product were detected in this tissue. The primers used for these products were as described for Fig. 6.
Similar articles
- Silencing of Fem1cR3 gene expression in the DBA/2J mouse precedes retinal ganglion cell death and is associated with histone deacetylase activity.
Pelzel HR, Schlamp CL, Waclawski M, Shaw MK, Nickells RW. Pelzel HR, et al. Invest Ophthalmol Vis Sci. 2012 Mar 15;53(3):1428-35. doi: 10.1167/iovs.11-8872. Print 2012 Mar. Invest Ophthalmol Vis Sci. 2012. PMID: 22297488 Free PMC article. - The Fem1c genes: conserved members of the Fem1 gene family in vertebrates.
Ventura-Holman T, Lu D, Si X, Izevbigie EB, Maher JF. Ventura-Holman T, et al. Gene. 2003 Sep 18;314:133-9. doi: 10.1016/s0378-1119(03)00712-1. Gene. 2003. PMID: 14527725 - Dmd(mdx-beta geo): a new allele for the mouse dystrophin gene.
Wertz K, Füchtbauer EM. Wertz K, et al. Dev Dyn. 1998 Jun;212(2):229-41. doi: 10.1002/(SICI)1097-0177(199806)212:2<229::AID-AJA7>3.0.CO;2-J. Dev Dyn. 1998. PMID: 9626497 - Structure and promoter analysis of Math3 gene, a mouse homolog of Drosophila proneural gene atonal. Neural-specific expression by dual promoter elements.
Tsuda H, Takebayashi K, Nakanishi S, Kageyama R. Tsuda H, et al. J Biol Chem. 1998 Mar 13;273(11):6327-33. doi: 10.1074/jbc.273.11.6327. J Biol Chem. 1998. PMID: 9497361 - ELF a beta-spectrin is a neuronal precursor cell marker in developing mammalian brain; structure and organization of the elf/beta-G spectrin gene.
Tang Y, Katuri V, Iqbal S, Narayan T, Wang Z, Lu RS, Mishra L, Mishra B. Tang Y, et al. Oncogene. 2002 Aug 8;21(34):5255-67. doi: 10.1038/sj.onc.1205548. Oncogene. 2002. PMID: 12149647
Cited by
- Evaluation of the percentage of ganglion cells in the ganglion cell layer of the rodent retina.
Schlamp CL, Montgomery AD, Mac Nair CE, Schuart C, Willmer DJ, Nickells RW. Schlamp CL, et al. Mol Vis. 2013 Jun 27;19:1387-96. Print 2013. Mol Vis. 2013. PMID: 23825918 Free PMC article. - Mouse models of retinal ganglion cell death and glaucoma.
McKinnon SJ, Schlamp CL, Nickells RW. McKinnon SJ, et al. Exp Eye Res. 2009 Apr;88(4):816-24. doi: 10.1016/j.exer.2008.12.002. Epub 2008 Dec 7. Exp Eye Res. 2009. PMID: 19105954 Free PMC article. Review. - Silencing of Fem1cR3 gene expression in the DBA/2J mouse precedes retinal ganglion cell death and is associated with histone deacetylase activity.
Pelzel HR, Schlamp CL, Waclawski M, Shaw MK, Nickells RW. Pelzel HR, et al. Invest Ophthalmol Vis Sci. 2012 Mar 15;53(3):1428-35. doi: 10.1167/iovs.11-8872. Print 2012 Mar. Invest Ophthalmol Vis Sci. 2012. PMID: 22297488 Free PMC article. - Histone H4 deacetylation plays a critical role in early gene silencing during neuronal apoptosis.
Pelzel HR, Schlamp CL, Nickells RW. Pelzel HR, et al. BMC Neurosci. 2010 May 26;11:62. doi: 10.1186/1471-2202-11-62. BMC Neurosci. 2010. PMID: 20504333 Free PMC article. - Tools and resources for analyzing gene expression changes in glaucomatous neurodegeneration.
Nickells RW, Pelzel HR. Nickells RW, et al. Exp Eye Res. 2015 Dec;141:99-110. doi: 10.1016/j.exer.2015.05.009. Epub 2015 May 19. Exp Eye Res. 2015. PMID: 25999234 Free PMC article. Review.
References
- Chan, S. L., K. O. Tan, L. Zhang, K. S. Y. Yee, F. Ronca, M. Y. Chan, and V. C. Yu. 1999. F1Aα, a death receptor-binding protein homologous to the Caenorhabditis elegans sex-determining protein FEM-1, is a caspase substrate that mediates apoptosis. J. Biol. Chem. 274:32461-32468. - PubMed
- Chan, S. L., K. S. Y. Yee, K. M. L. Tan, and V. C. Yu. 2000. The Caenorhabditis elegans sex determination protein FEM-1 is a CED-3 substrate that associates with CED-4 and mediates apoptosis in mammalian cells. J. Biol. Chem. 275:17925-17928. - PubMed
- Chen, Z., G. A. Friedrich, and P. Soriano. 1994. Transcriptional enhancer factor 1 disruption by a retroviral gene trap leads to heart defects and embryonic lethality in mice. Genes Dev. 8:2293-2301. - PubMed
Publication types
MeSH terms
Substances
Grants and funding
- R01 EY012223/EY/NEI NIH HHS/United States
- R29 EY012223/EY/NEI NIH HHS/United States
- R03 EY013790/EY/NEI NIH HHS/United States
- R29 EY 12223/EY/NEI NIH HHS/United States
- R03 EY13790/EY/NEI NIH HHS/United States
LinkOut - more resources
Full Text Sources
Molecular Biology Databases
Miscellaneous


