Estimating metazoan divergence times with a molecular clock - PubMed (original) (raw)
Estimating metazoan divergence times with a molecular clock
Kevin J Peterson et al. Proc Natl Acad Sci U S A. 2004.
Abstract
Accurately dating when the first bilaterally symmetrical animals arose is crucial to our understanding of early animal evolution. The earliest unequivocally bilaterian fossils are approximately 555 million years old. In contrast, molecular-clock analyses calibrated by using the fossil record of vertebrates estimate that vertebrates split from dipterans (Drosophila) approximately 900 million years ago (Ma). Nonetheless, comparative genomic analyses suggest that a significant rate difference exists between vertebrates and dipterans, because the percentage difference between the genomes of mosquito and fly is greater than between fish and mouse, even though the vertebrate divergence is almost twice that of the dipteran. Here we show that the dipteran rate of molecular evolution is similar to other invertebrate taxa (echinoderms and bivalve molluscs) but not to vertebrates, which significantly decreased their rate of molecular evolution with respect to invertebrates. Using a data set consisting of the concatenation of seven different amino acid sequences from 23 ingroup taxa (giving a total of 11 different invertebrate calibration points scattered throughout the bilaterian tree and across the Phanerozoic), we estimate that the last common ancestor of bilaterians arose somewhere between 573 and 656 Ma, depending on the value assigned to the parameter scaling molecular substitution rate heterogeneity. These results are in accord with the known fossil record and support the view that the Cambrian explosion reflects, in part, the diversification of bilaterian phyla.
Figures
Fig. 1.
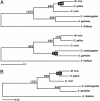
Rate heterogeneity between vertebrates and dipterans, as assessed by untenable estimates for the divergences of the uncalibrated taxa. (A) ML analysis of the 50-gene data set for vertebrates and dipterans using Arabidopsis as the outgroup. (Upper) Values derived for the origin of bony fish, Diptera, and Bilateria if the tree is calibrated using the amniote divergence at 300 Ma. (Lower) Values derived for the origin of bony fish, amniotes, and bilaterians if the tree is calibrated by using the dipteran divergence at 235 Ma. (B) ML analysis of the seven-gene data set from the same taxa. If the tree is calibrated by using the amniote divergence at 300 Ma, qualitatively similar values as found in A are derived for the origin of bony fish, dipterans, and bilaterians.
Fig. 2.
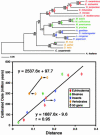
ML tree of the seven concatenated protein sequences from 18 in-group taxa by using Arabidopsis as the outgroup. Bootstrap values for ML (Upper) as well as distance (Lower) are given to the left of the respective nodes. Nodes 1–11 are calibration points, whose distances are plotted against the divergence times derived from the fossil record (Table 1) in the regression analysis. The two vertebrate divergences (300 Ma for Amniota and 450 Ma for Osteichthyes) give the vertebrate line whose midpoint value is significantly displaced from the invertebrate line. The open diamonds indicate the position of the node when analyzed with the 50-gene data set; note that it is qualitatively similar to the seven-gene data set (filled diamonds). Echinoderms are shown in red, bivalves in green, and insects in blue; vertebrates are in orange.
Fig. 3.
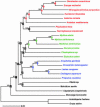
Distance (Poisson) phylogram of the seven concatenated protein sequences from 23 in-group taxa by using Arabidopsis and Oryza as outgroups. Bootstrap values are given to the left of the respective nodes. Nodes 1–11 are calibration points (see Fig. 2); the ages of nodes A–K are estimated by using
r8s
and are given in Table 1 and shown in Fig. 4. Deuterostomes are shown in red, spiralians in green, and ecdysozoans in blue.
Fig. 4.
Metazoan divergence estimates with metazoan diversity and phylogeny placed into the geological context of the Neoproterozoic/Cambrian transition. Tree nodes are positioned according to age estimates derived from the Poisson analysis (Table 1). Thick lines are the known fossil record, and thin lines are the lineage extensions as deduced from the molecular clock analysis. N-D, Nemakit–Daldynian; T/A, Tommotian/Atdabanian; B/T, Botominan/Toyonian; M, Middle; L, Late (adapted from ref. 1).
References
- Knoll, A. H. & Carroll, S. B. (1999) Science 284, 2129-2137. - PubMed
- Runnegar, B. (1982) J. Geol. Soc. Aust. 29, 395-411.
- Smith, A. B. & Peterson, K. J. (2002) Annu. Rev. Earth Planet. Sci. 30, 65-88.
- Benton, M. J. & Ayala, F. J. (2003) Science 300, 1698-1700. - PubMed
- Wray, G. A., Levinton, J. S. & Shapiro, L. H. (1996) Science 274, 568-573.
Publication types
MeSH terms
Substances
LinkOut - more resources
Full Text Sources
Molecular Biology Databases


