A high-density admixture map for disease gene discovery in african americans - PubMed (original) (raw)
. 2004 May;74(5):1001-13.
doi: 10.1086/420856. Epub 2004 Apr 14.
Nick Patterson, James A Lautenberger, Ann L Truelove, Gavin J McDonald, Alicja Waliszewska, Bailey D Kessing, Michael J Malasky, Charles Scafe, Ernest Le, Philip L De Jager, Andre A Mignault, Zeng Yi, Guy De The, Myron Essex, Jean-Louis Sankale, Jason H Moore, Kwabena Poku, John P Phair, James J Goedert, David Vlahov, Scott M Williams, Sarah A Tishkoff, Cheryl A Winkler, Francisco M De La Vega, Trevor Woodage, John J Sninsky, David A Hafler, David Altshuler, Dennis A Gilbert, Stephen J O'Brien, David Reich
Affiliations
- PMID: 15088270
- PMCID: PMC1181963
- DOI: 10.1086/420856
A high-density admixture map for disease gene discovery in african americans
Michael W Smith et al. Am J Hum Genet. 2004 May.
Abstract
Admixture mapping (also known as "mapping by admixture linkage disequilibrium," or MALD) provides a way of localizing genes that cause disease, in admixed ethnic groups such as African Americans, with approximately 100 times fewer markers than are required for whole-genome haplotype scans. However, it has not been possible to perform powerful scans with admixture mapping because the method requires a dense map of validated markers known to have large frequency differences between Europeans and Africans. To create such a map, we screened through databases containing approximately 450000 single-nucleotide polymorphisms (SNPs) for which frequencies had been estimated in African and European population samples. We experimentally confirmed the frequencies of the most promising SNPs in a multiethnic panel of unrelated samples and identified 3011 as a MALD map (1.2 cM average spacing). We estimate that this map is approximately 70% informative in differentiating African versus European origins of chromosomal segments. This map provides a practical and powerful tool, which is freely available without restriction, for screening for disease genes in African American patient cohorts. The map is especially appropriate for those diseases that differ in incidence between the parental African and European populations.
Figures
Figure 1
Power of the individual 2,154 MALD markers (white bars), as a fraction of the maximum (power is calculated by eq. [1]). Power increases strikingly when the methods described by Patterson et al. ( [in this issue]) are used to combine data from multiple, closely linked markers (black bars).
Figure 2
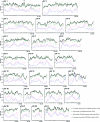
Power of the 2,154-marker map as a fraction of what would be expected if there was full information about ancestry available at every point (e.g., nearly complete information [a value of 1 on the _Y_-axis] is available at Duffy on chromosome 1, indicated by a star). The black line is the power of the African American map under the assumption of an average of six generations since admixture (the power would be lower for individuals with more generations since admixture). We were also able to roughly estimate the quality of the map for studies involving Amerindian and East Asian mixtures under the assumption of six generations since admixture, although these estimates are less reliable because the sample sizes were smaller.
Figure 3
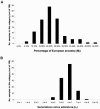
A, Distribution of percentage of European ancestry (M i) in 109 African American samples genotyped at 2,154 MALD markers (mean ± SD = 20% ± 8%). B, Distribution of estimated number of generations since admixture (λ_i_) for 109 African Americans (mean ± SD = 6.3 ± 1.1). All estimates are generated by the ANCESTRYMAP software from the accompanying article by Patterson et al. ( [in this issue]). We emphasize that the number of “generations since admixture” is an average across a person’s lineages, since mixing between Africans and Europeans has occurred over many generations.
Figure 4
Predicted probability of no recombination having occurred since admixture between a disease locus and a nearby marker locus, predicting the shape of a peak of association in an African American admixture study. The analysis was based on the distribution of the estimated number of generations since admixture (λ_i_) values estimated from 109 African Americans (fig. 3_B_). We present the probability of a crossover between ancestry segments, as a function of the distance between a disease locus and mapping marker. At 4.5 cM, we expect the strength of association to drop to 75% of its maximum (measured as LOD or log of the P value). At 11 cM and 23 cM, the power drops to 50% and 25% of its maximum, respectively.
Figure 5
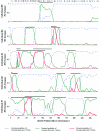
Estimates of ancestry along chromosome 1 for five African American samples, estimated by use of the Patterson et al. ( [in this issue]) ANCESTRYMAP software. The positions of the 169 markers in the map on chromosome 1 that were used for this inference are indicated by hash marks (inferred European chromosome segments are indicated by black bars). Sharp transitions between segments of 0, 1, or 2 European alleles are clear from the analysis, indicating the high resolution of the map.
Similar articles
- Methods for high-density admixture mapping of disease genes.
Patterson N, Hattangadi N, Lane B, Lohmueller KE, Hafler DA, Oksenberg JR, Hauser SL, Smith MW, O'Brien SJ, Altshuler D, Daly MJ, Reich D. Patterson N, et al. Am J Hum Genet. 2004 May;74(5):979-1000. doi: 10.1086/420871. Epub 2004 Apr 14. Am J Hum Genet. 2004. PMID: 15088269 Free PMC article. - Markers for mapping by admixture linkage disequilibrium in African American and Hispanic populations.
Smith MW, Lautenberger JA, Shin HD, Chretien JP, Shrestha S, Gilbert DA, O'Brien SJ. Smith MW, et al. Am J Hum Genet. 2001 Nov;69(5):1080-94. doi: 10.1086/323922. Am J Hum Genet. 2001. PMID: 11590548 Free PMC article. - Ethnic-difference markers for use in mapping by admixture linkage disequilibrium.
Collins-Schramm HE, Phillips CM, Operario DJ, Lee JS, Weber JL, Hanson RL, Knowler WC, Cooper R, Li H, Seldin MF. Collins-Schramm HE, et al. Am J Hum Genet. 2002 Mar;70(3):737-50. doi: 10.1086/339368. Epub 2002 Feb 11. Am J Hum Genet. 2002. PMID: 11845411 Free PMC article. - Genetic admixture: a tool to identify diabetic nephropathy genes in African Americans.
Divers J, Moossavi S, Langefeld CD, Freedman BI. Divers J, et al. Ethn Dis. 2008 Summer;18(3):384-8. Ethn Dis. 2008. PMID: 18785456 Review. - On selecting markers for association studies: patterns of linkage disequilibrium between two and three diallelic loci.
Garner C, Slatkin M. Garner C, et al. Genet Epidemiol. 2003 Jan;24(1):57-67. doi: 10.1002/gepi.10217. Genet Epidemiol. 2003. PMID: 12508256 Review.
Cited by
- APOL1 Genotype and Glomerular and Tubular Kidney Injury in Women With HIV.
Jotwani V, Shlipak MG, Scherzer R, Parekh RS, Kao WH, Bennett M, Cohen MH, Nowicki M, Sharma A, Young M, Tien PC, Parikh CR, Estrella MM. Jotwani V, et al. Am J Kidney Dis. 2015 Jun;65(6):889-98. doi: 10.1053/j.ajkd.2015.02.329. Epub 2015 Apr 24. Am J Kidney Dis. 2015. PMID: 25921719 Free PMC article. - Confounding and heterogeneity in genetic association studies with admixed populations.
Liu J, Lewinger JP, Gilliland FD, Gauderman WJ, Conti DV. Liu J, et al. Am J Epidemiol. 2013 Feb 15;177(4):351-60. doi: 10.1093/aje/kws234. Epub 2013 Jan 18. Am J Epidemiol. 2013. PMID: 23334005 Free PMC article. - Inferring parental genomic ancestries using pooled semi-Markov processes.
Zou JY, Halperin E, Burchard E, Sankararaman S. Zou JY, et al. Bioinformatics. 2015 Jun 15;31(12):i190-6. doi: 10.1093/bioinformatics/btv239. Bioinformatics. 2015. PMID: 26072482 Free PMC article. - Admixture mapping identifies 8q24 as a prostate cancer risk locus in African-American men.
Freedman ML, Haiman CA, Patterson N, McDonald GJ, Tandon A, Waliszewska A, Penney K, Steen RG, Ardlie K, John EM, Oakley-Girvan I, Whittemore AS, Cooney KA, Ingles SA, Altshuler D, Henderson BE, Reich D. Freedman ML, et al. Proc Natl Acad Sci U S A. 2006 Sep 19;103(38):14068-73. doi: 10.1073/pnas.0605832103. Epub 2006 Aug 31. Proc Natl Acad Sci U S A. 2006. PMID: 16945910 Free PMC article. - A genomewide single-nucleotide-polymorphism panel with high ancestry information for African American admixture mapping.
Tian C, Hinds DA, Shigeta R, Kittles R, Ballinger DG, Seldin MF. Tian C, et al. Am J Hum Genet. 2006 Oct;79(4):640-9. doi: 10.1086/507954. Epub 2006 Aug 15. Am J Hum Genet. 2006. PMID: 16960800 Free PMC article.
References
Electronic-Database Information
- Applied Biosystems myScience Web site, http://myscience.appliedbiosystems.com
- Laboratory of Genomic Diversity, http://home.ncifcrf.gov/ccr/lgd/human_genome/mald/index_n.asp (for figures showing positions of map SNPs in the genome)
- SNP Consortium, http://snp.cshl.org/allele_frequency_project/
- University of Washington Fred Hutchinson Cancer Research Center (UW-FHCRC) Variation Discovery Resource, http://pga.gs.washington.edu/
References
- Adams MD, Cargill MA, Spier EG, De La Vega FM, Olson SJ, White TJ, Sninsky JJ, Gilbert DA, Hunkapiller MW (2002) Applied genomics: exploring functional variation and gene expression. Am J Hum Genet Suppl 71:203
- Briscoe D, Stephens JC, O’Brien SJ (1994) Linkage disequilibrium in admixed populations: applications in gene mapping. J Hered 85:59–63 - PubMed
- Chen M-H, Shao Q-M, Ibrahim JG (2000) Monte Carlo methods in Bayesian computation. Springer, New York
Publication types
MeSH terms
Substances
Grants and funding
- R01 HL065234/HL/NHLBI NIH HHS/United States
- HL-65234/HL/NHLBI NIH HHS/United States
- U19-AI50864/AI/NIAID NIH HHS/United States
- N01-C0-12400/PHS HHS/United States
- K-01 HG002758-01/HG/NHGRI NIH HHS/United States
- U19 AI050864/AI/NIAID NIH HHS/United States
- N01 CO012400/CA/NCI NIH HHS/United States
- K01 HG002758/HG/NHGRI NIH HHS/United States
- K08 NS046341/NS/NINDS NIH HHS/United States
LinkOut - more resources
Full Text Sources
Other Literature Sources
Medical


